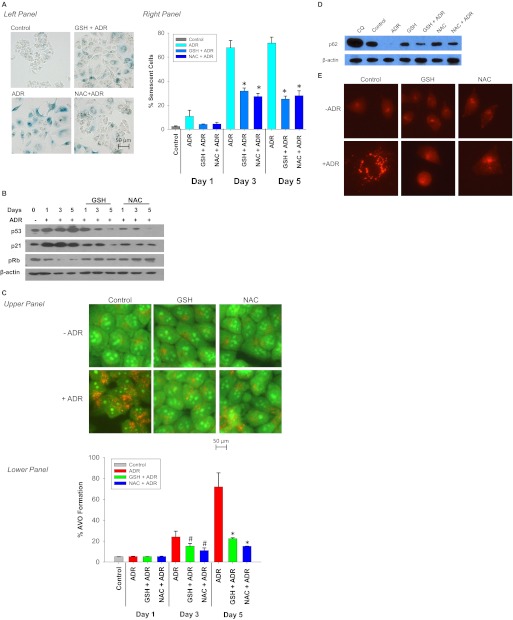
Fig. 2.
Involvement of free radicals in ADR-induced senescence and autophagy. MCF-7 cells were pretreated with 20 μM GSH or 20 μM NAC for 1 h followed by 1 μM ADR for 2 h. The drugs were removed, and fresh media were restored. A, senescence was evaluated by β-galactosidase staining 72 h after treatment (left) and quantified for C12FDG-fluorescin fluorescence by FACS analysis (right). *, p < 0.001 compared with control. B, immunoblot analysis of p53, p21, pRb, and β-actin. C, acridine orange staining visualized by fluorescence microscopy (top) and quantified by FACS analysis (bottom). #, p < 0.05 compared with ADR treatment on day 3; *, p < 0.001 compared with ADR treatment on day 5. D, immunoblot analysis of p62 and β-actin were evaluated 72 h after treatment. E, fluorescence microscopy for RFP-LC3 at 72 h after initiation of the indicated treatments.

