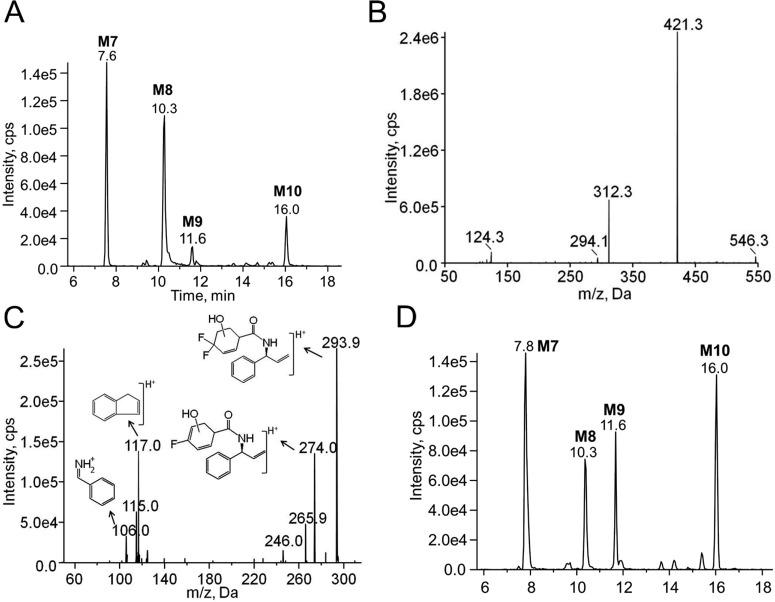
Fig. 8.
Chromatograms and MSn spectra of the maraviroc dioxygenated metabolites. A, chromatogram of dioxygenated maraviroc metabolites (M7–M10) detected using the transition m/z 546 → 312 from metabolism reactions using human liver microsomes. B, representative MS2 spectra of M7 to M10 with the precursor ion m/z 546. C, representative MS3 spectra of M7 to M10 with first/second precursor ions at m/z 546/312. The proposed structures of fragmented ions are shown near the corresponding peaks. D, chromatogram of dioxygenated maraviroc metabolites (M7–M10) detected in urine collected at 0 to 2 h from a healthy volunteer using the transition m/z 546 → 312.

