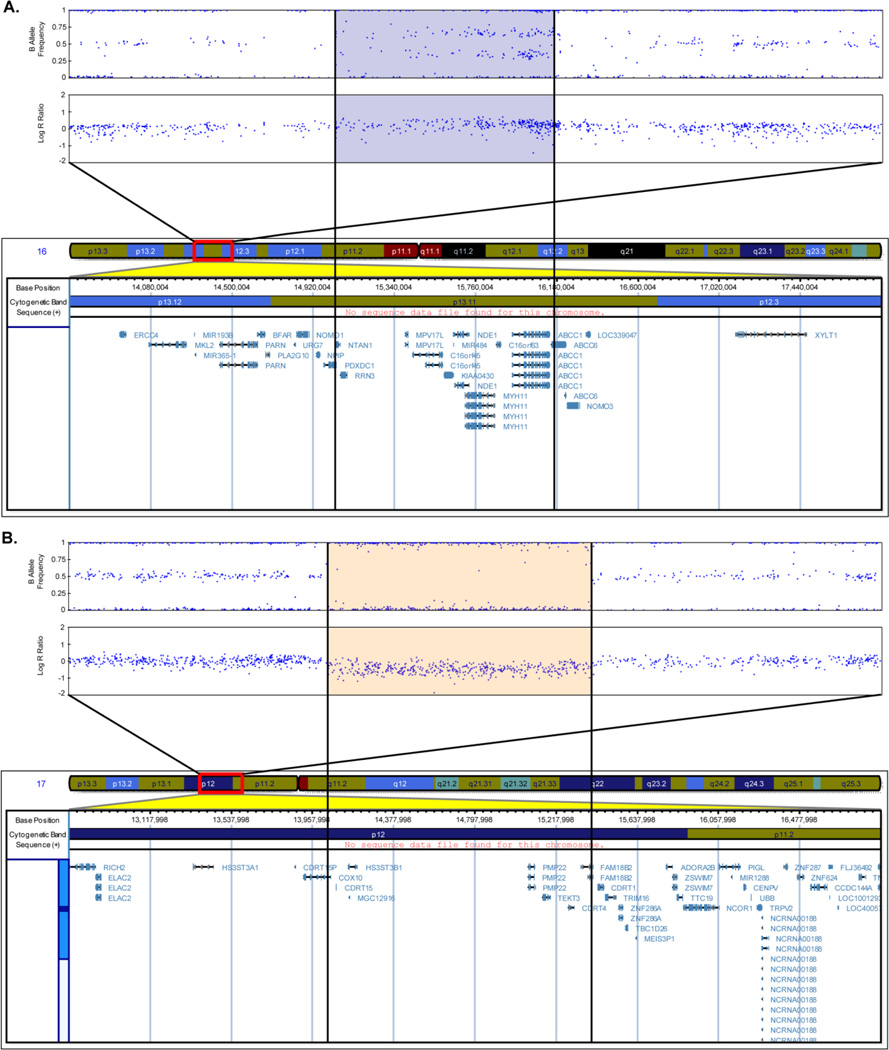
Figure 3.
Representative images of B Allele Frequency and Log R Ratio of the Alzheimer’s disease participants who had a duplication at 16p13.11 (A) and a deletion at 17p12 (B) along with chromosomal coordinates and genes in corresponding regions are shown. Blue dots in the B Allele Frequency and Log R Ratio plots represent SNPs. The blue shaded portion (A) indicates the duplicated region and the orange shaded portion (B) the deleted region (Human Genome Build 36.1).

