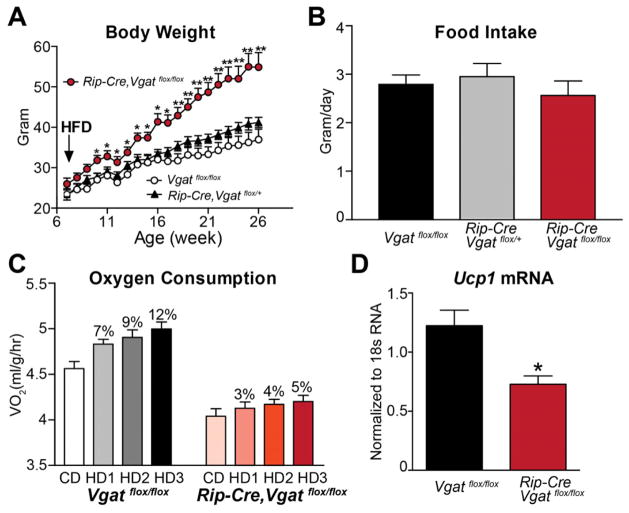
Figure 3. Diet-induced Obesity in Mice Lacking VGAT in RIP-Cre Neurons.
(A) Body weight on HFD and (B) daily food intake averaged over the first two weeks on HFD (n=8–10).
(C) Oxygen consumption expressed per body weight during the transition from chow to HFD (n=8). CD = Averaged oxygen consumption over 3 days on chow. HD1, HD2 and HD3 = oxygen consumption during day 1, 2 and 3, respectively, on HFD. The percentage increase in oxygen consumption on HFD above that on chow diet is indicated above each bar.
(D) Ucp1 mRNA level in iBAT of HFD-treated littermates (n=6–8).
Data are presented as mean ± SEM. *p< 0.05 and **p<0.01, unpaired t-test compared with Vgatflox/flox group.

