
Figure 1.
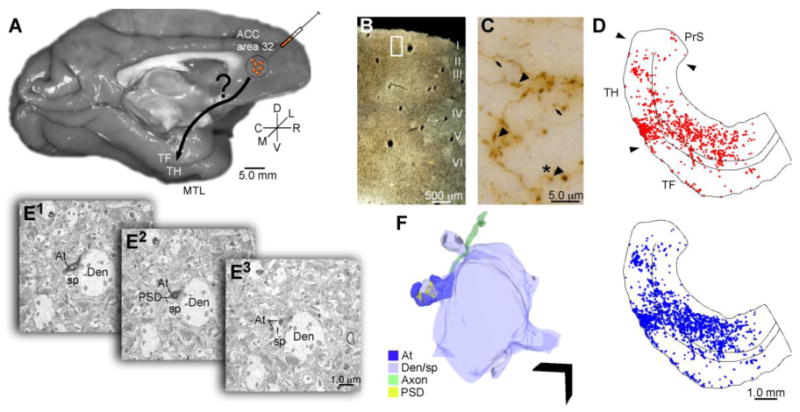
Overview of experimental design. A, The anterograde tracer biotinylated dextran amine (BDA) or lucifer yellow (LY) was injected in ACC area 32 in rhesus monkeys (Macaca mulatta). B, C, D, Large (>0.97 μm) and small (≤0.97 μm) labeled boutons in the MTL were mapped and quantified in parahippocampal areas TH and TF using a combination of exhaustive sampling and stereological techniques (large boutons denoted by arrowheads in C, blue dots in D; small boutons denoted by arrows in C, red dots in D; the white rectangle in B shows the location of the image presented in C). Panel D is shown in complete coronal section in Figure 2B. E, F, Adjacent sections of tissue through the parahippocampal cortex were processed to view tracer label and the calcium binding proteins parvalbumin (PV) and calbindin (CB) using triple labeling immunohistochemistry and processed for electron microscopy. E1-3, Serial ultrathin sections through labeled boutons and their postsynaptic targets were imaged at the EM level and reconstructed in 3D (F); Scale bar = 1 μm. Abbreviations: At: axon terminal; Den/sp: dendrite/spine; EM: electron microscope; PSD: postsynaptic density.