
Figure 6.
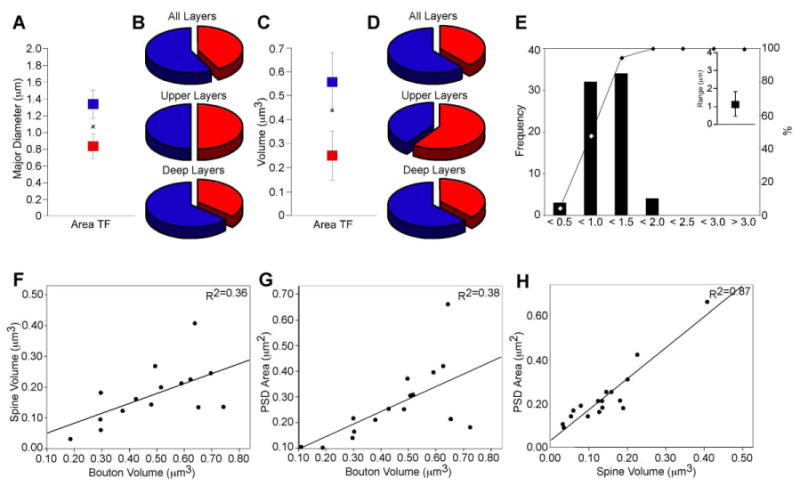
Synaptic characteristics of ACC (area 32) boutons projecting to the parahippocampal cortices. EM analysis: A, Bouton major diameter clusters in area TF following 2D analysis at the EM. The average major diameter for the distribution was 1.1 μm (denoted by x). B, The ratio of large (blue) to small (red) boutons, based on the values determined from the cluster analysis, approached 50:50 in the superficial and was biased for more large boutons (blue) in the deep layers. C, Bouton volume clusters in area TF following 3D analysis at the electron microscope. The average volume for the distribution was equal to 0.44 μm3 (denoted by x). D, The ratio of large (blue) to small (red) boutons, based on the values determined from the cluster analysis on the 3D data, approached 50:50 in the superficial and was biased for more large boutons (blue) in the deep layers. Note the similarity between B and D and the distribution of large and small boutons assessed at the light microscope (see Figure 4D-F). E, Bouton major diameter frequency distributions following 2D analysis at the EM. Inset shows the range of the distribution. Bouton frequency distribution quantified at the EM was similar to data obtained at the light microscope (see Figure 4A, 4B). F, Correlation between the size of presynaptic and postsynaptic sites for bouton volume and spine volume; and G, bouton volume and PSD area. H, There is a strong correlation between spine volume and PSD area. Abbreviations: ACC: anterior cingulate cortex; PSD: postsynaptic density.