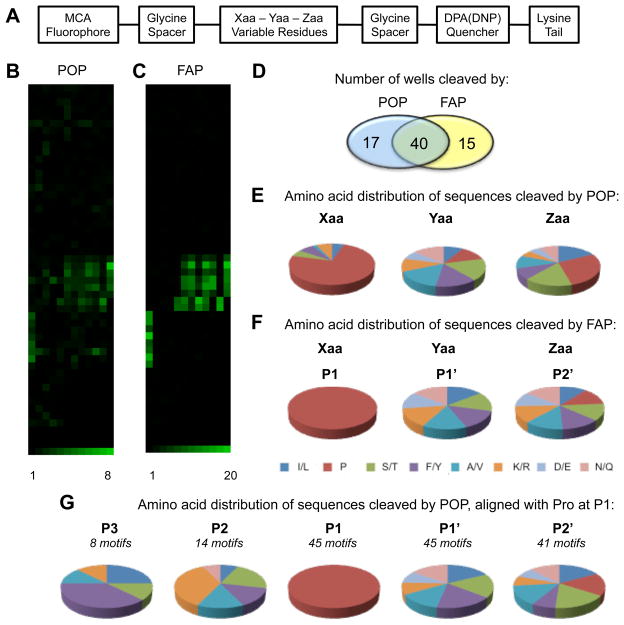
Figure 1. Substrate specificities of POP and FAP.
(A) Schematic illustration of a representative internally quenched fluorogenic probe. (B-C) Graphical heatmap representations of the substrate specificities of POP (B) and FAP (C). Colored squares represent individual wells of stacked 96 well microplates [3]. The numbers at the bottom of the heat map corresponds to the fluorescence fold change values (upper and lower limit) used in generating the heat maps. The fold change values were calculated as described in the materials and methods section (D) Venn diagram indicating the numbers of selective and promiscuous IQFP motifs detected. (E–F) Amino acid distribution of all IQFP sequences cleaved by POP (E) and FAP (F). Individual motifs are listed in Tables 1 and S1 (G) Amino acid distribution of IQFP sequences cleaved by POP aligned with Pro fixed at P1. The % amino acid distribution values for each pie chart are presented in Tables S3 and S4.

