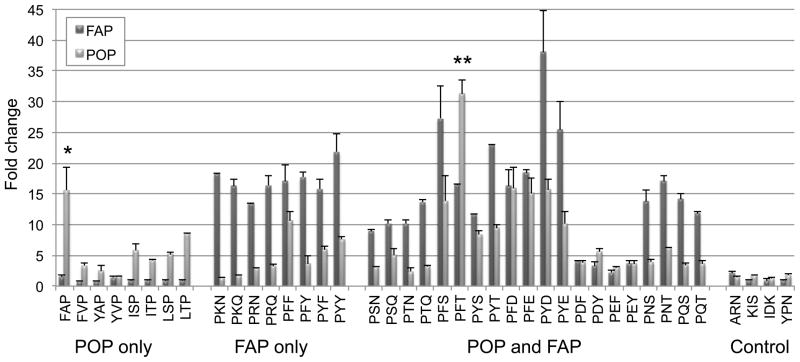
Figure 3. Deconvolution of IQFP substrates.
Extent of cleavage is expressed as endpoint fluorescence fold change at 6 h. Dark bars denote cleavage by FAP, while light bars denote cleavage by POP. Error bars represent standard deviations. * p < 0.05 versus FVP and YAP for cleavage by POP. ** p < 0.05 versus PFS, PYS, and PYT for cleavage by POP.

