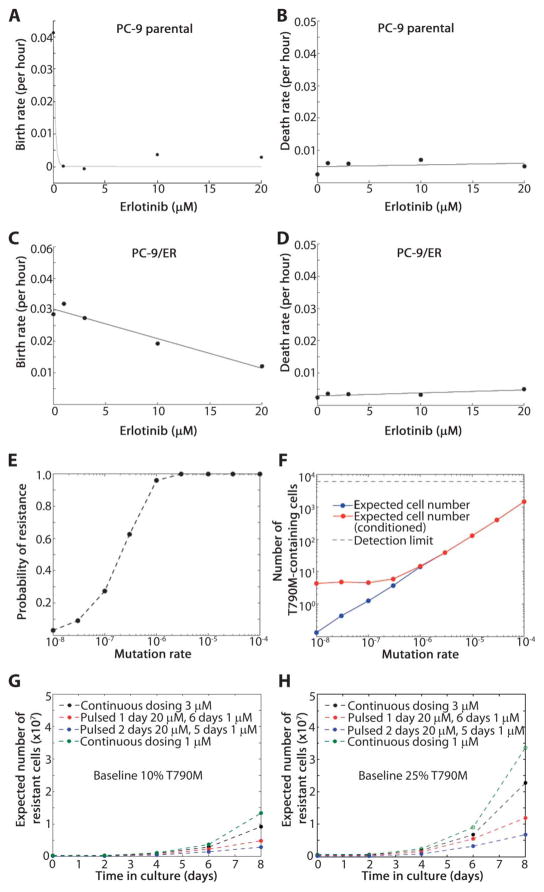
Fig. 5.
Evolutionary cancer modeling predictions to delay the development of resistance. (A) PC-9 cell birth rate at erlotinib concentrations of 0, 1, 3, 10, and 20 μM. (B) PC-9 cell death rate as a function of increasing erlotinib concentration. (C) PC-9/ER cell birth rate in the presence of erlotinib (0, 1, 3, 10, and 20 μM). (D) PC-9/ER cell death rates as a function of increasing erlotinib concentration. (E) Probability of preexisting T790M-harboring cells in a population of 3 million cells initiating from one cell harboring just a drug-sensitive EGFR mutation that grew in the absence of drug for a range of mutation rates (10−4 to 10−8 per cell division). (F) Expected number of resistant cells present in the population, both averaged over all cases and averaged only over the subset of cases, where at least one resistant cell is present. (G) An initial population of 750,000 cells, 10% of which harbor T790M, treated with continuous low-dose erlotinib (1 and 3 μM) selects for the emergence of T790M-harboring cells (green and black lines). The addition of one or two high-dose erlotinib “pulses” (20 μM) followed by 1 μM for the remaining days of a 7-day cycle decreases the expected number of resistant cells (red and blue lines). (H) Analogous results as in panel (G) starting with an initial population with 25% T790M-harboring cells.

