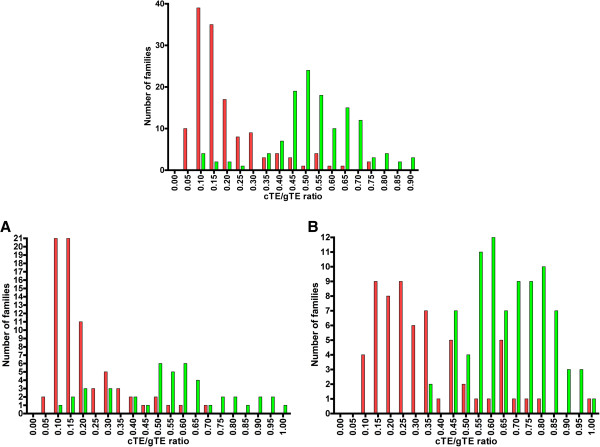
Figure 1.
Frequency distribution of 266 conserved repetitive families based on their repeat counts in the conserved regions (cTE) and in the entire human genome (gTE). Each family is counted in the interval (bin) with its corresponding cTE/gTE ratio (vertical axis). The red bars indicate families present in mammals only, and the green bars represent families shared by mammals and chicken. A. Frequency distribution of 119 classified families of conserved TEs, analogous to that in Figure 1. B. Frequency distribution of 147 unclassified families of conserved TEs, analogous to that in Figure 1.

