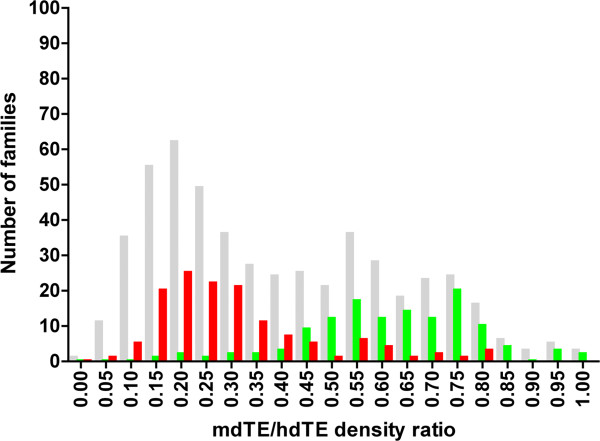
Figure 2.
Frequency distribution of the mammalian-wide families based on the ratio of repeat densities in the mouse and in the human genome. The repeat densities for each family were calculated per 1 Mb of the mouse (mdTE) and of the human genome (hdTE). Each bar represents the number of families (vertical axis) with their mdTE/hdTE values within the same interval (bin). The grey bars illustrate the distribution of all mammalian-wide families except of those with mdTE/hdTE > 1 (for details see Materials and Methods). The red bars represent a subset of conserved families present in mammals only, and the green bars represent a subset of families shared by mammals and chicken.

