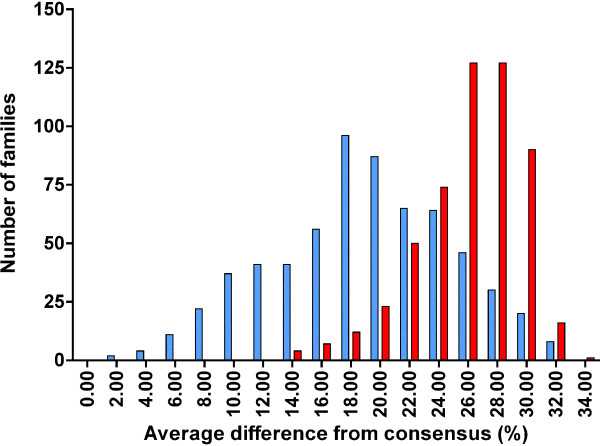
Figure 3.
Numbers of the human-specific families (blue bars) and mammalian-wide families of TEs (red bars), corresponding to average sequence differences of individual repeats from their respective family consensus sequences. Average sequence difference equals 100 minus the average percentage of sequence identity to the family consensus sequence.

