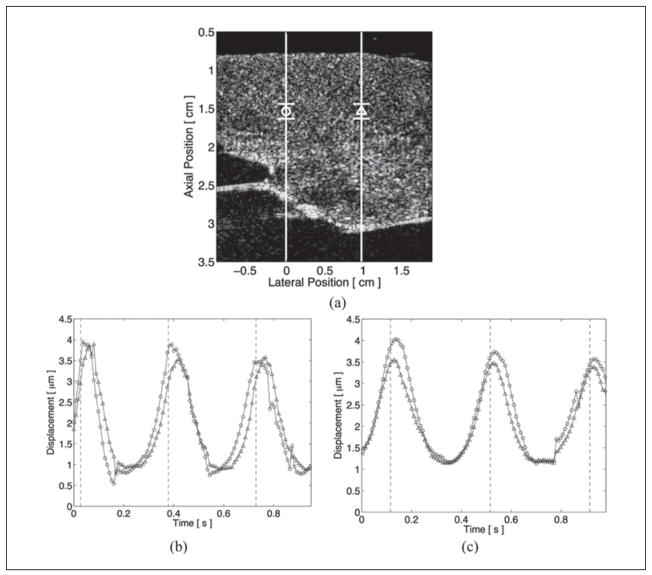
Figure 3.
Matched B-mode and active two-line M-mode acoustic radiation force impulse (ARFI) images of an externally paced left ventricle. The lateral locations and regions of interest are marked with their respective shapes within the B-mode image (a). Pacing electrodes were positioned on either side of the lateral field of view. The times when the myocardium was stimulated by the pacing electrodes are marked by the dashed vertical lines within the ARFI-induced displacement plots. When pacing from the left (b), myocardial stiffening at the left lateral location (circle plot) leads the right (triangle plot). When pacing from the right (c), the reverse trend is seen, and myocardial stiffening at the right lateral location now leads the left.

