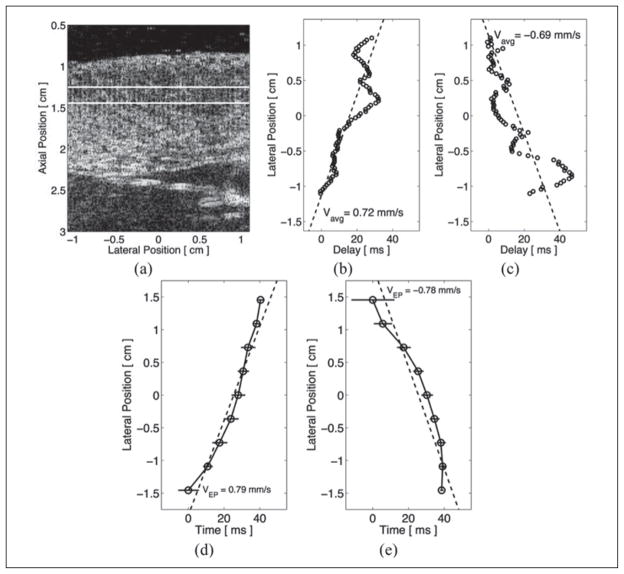
Figure 5.
Matched B-mode and time delays between acoustic radiation force impulse (ARFI)–induced tissue displacement curves and times to peak negative epicardial voltages when paced by an external source. The ARFI imaging region of interest is marked by the two horizontal lines within the matched B-mode image (a). The lateral location most proximal to the selected pacing source was defined as the reference line and zero delay. When pacing from either the left (b) or the right (c) side of the image, time delays between the other lateral locations and that reference line were estimated using the normalized cross-correlation method. Time delays to peak negative voltages are shown when observing electrical propagation while pacing from the left (d) or the right (e) side of the image. Using a least squares linear approximation (dashed lines), the average propagation velocities of the left- and right-traveling stiffness propagation were measured to be −0.69 m/s and 0.72 m/s, respectively. The corresponding electrical lateral propagation velocities were measured to be −0.78 m/s and 0.79 m/s, respectively.

