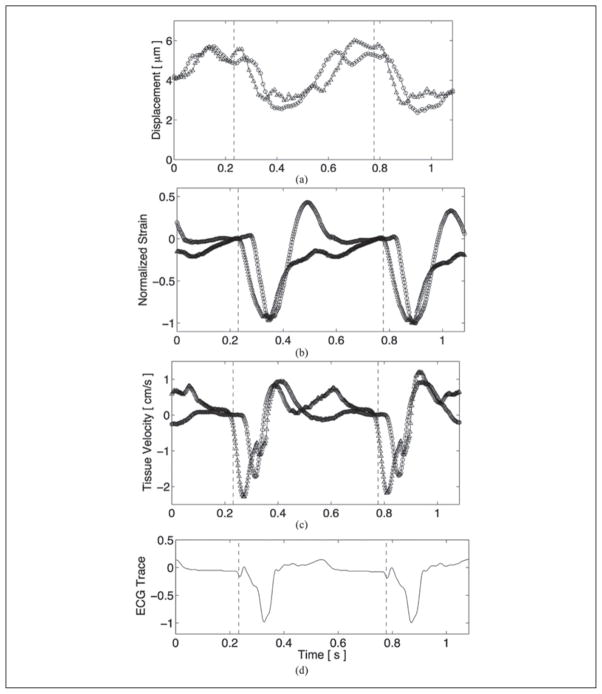
Figure 6.
Electromechanical propagation comparison between acoustic radiation force impulse (a), normalized strain (b), and tissue velocity (c) imaging with the matched global electrocardiogram (d). The points of application of the pacing electrode are marked by the dashed vertical lines in each plot. For all three cases, the M-mode line proximal to the pacing source (triangle plot) leads the distal M-mode line (circle plot) at systole.

