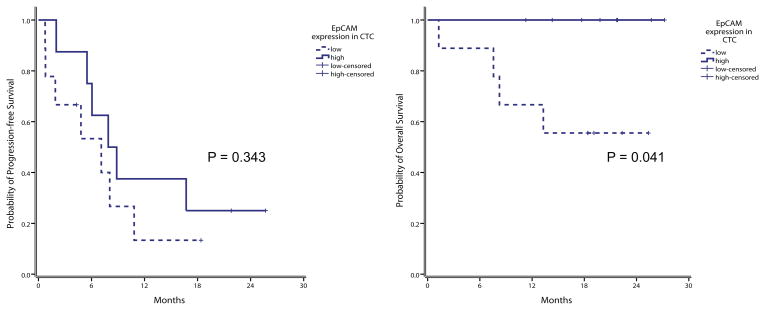
Figure 4.
(A) Progression-free survival (PFS) and (B) overall survival (OS) Kaplan Meier curves for all 17 patients according to EpCAM transcript expression in the CD326+ cell fraction. EpCAM high expression in green (n = 8); EpCAM low expression in blue (n = 9); time was measured from the basal blood draw to the death for OS and to radiologic evidence of disease progression (PFS).

