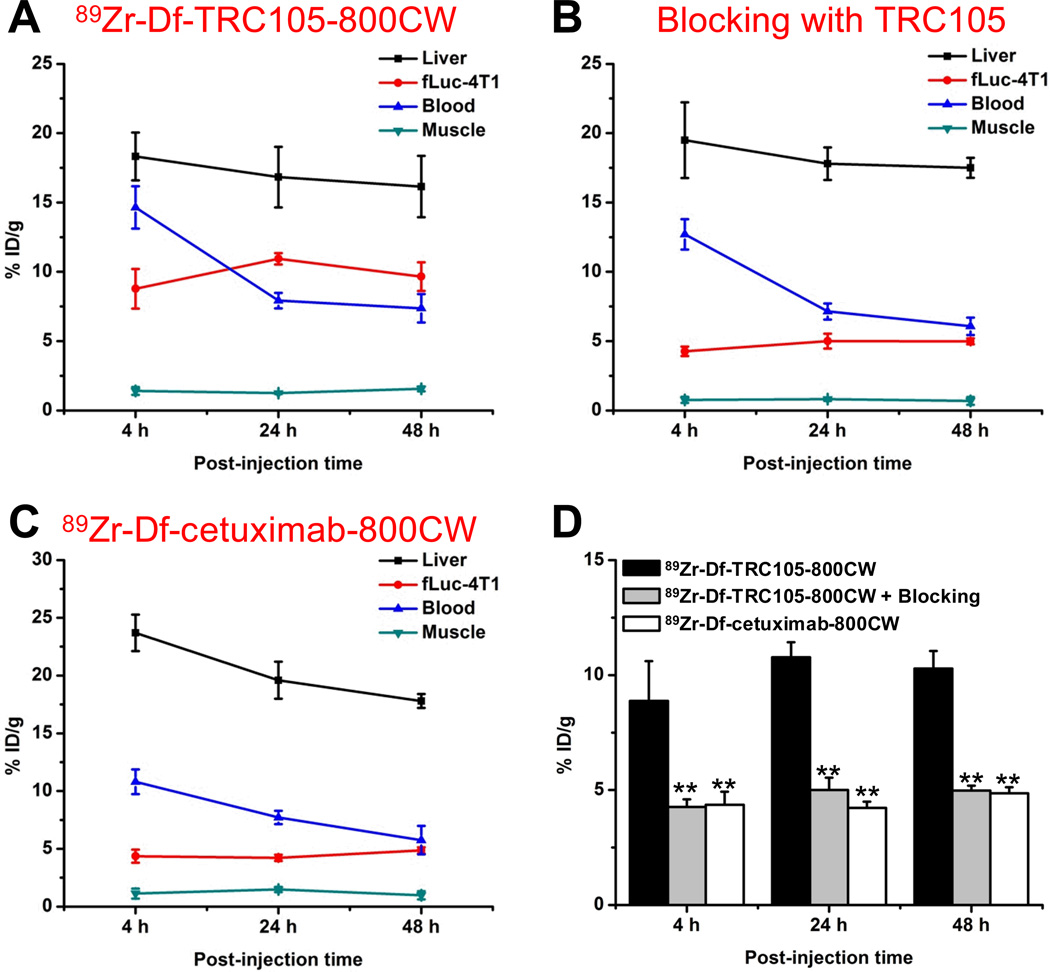
Figure 4.
Quantitative analysis of the PET data. A. Time-activity curves of the liver, fLuc-4T1 tumor, blood, and muscle upon intravenous injection of 89Zr-Df-TRC105-800CW. B. Time-activity curves of the liver, fLuc-4T1 tumor, blood, and muscle upon intravenous injection of 89Zr-Df-TRC105-800CW, after a blocking dose of TRC105. C. Time-activity curves of the liver, fLuc-4T1 tumor, blood, and muscle upon intravenous injection of 89Zr-Df-cetuximab-800CW. D. Comparison of the fLuc-4T1 tumor uptake in the three groups. n = 4; **: P < 0.01.

