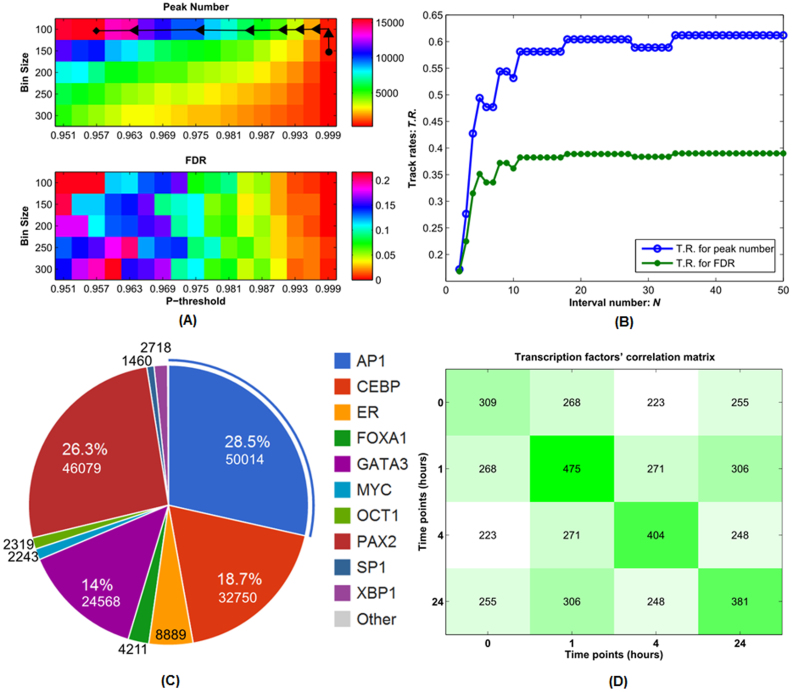
Figure 2. The selection of optimal parameters for the ERα ChIP-seq data at time point 0 hour.
A distribution of peak numbers (the upper panel) and FDR (the lower panel) vs. the p-threshold (A). A track rate distribution for peak number and FDR with respect to the interval number N (B). The global peak number and FDR distributions, track rate distributions for peak number and FDR plots at other time points are given in the Supplemental Figures S1–3. C and D. The identification of TF hubs according to the occurrence frequency of those candidates (C). The percentages denote the corresponding occurrence distribution among all candidates identified from the time-series ChIP-seq data. TF candidates' pairwise intersection matrix across all the four time points (D). The diagonal entries denote the candidate counts at the corresponding time points, and other non-diagonal entries denote those candidate counts of intersection identified between any two different time points.

