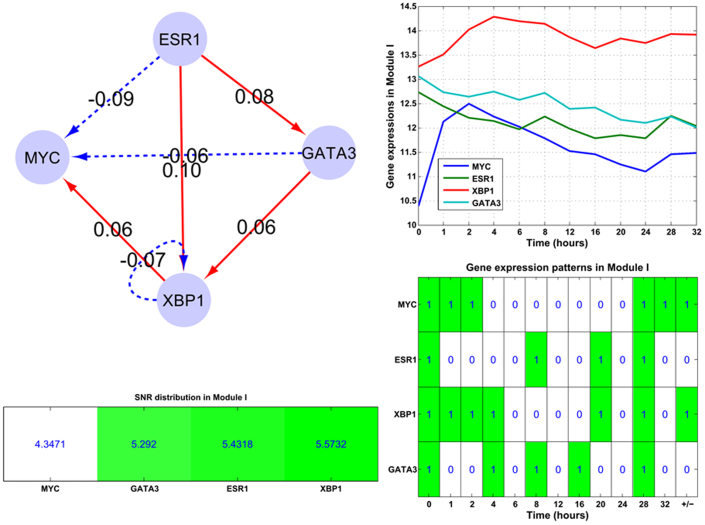
Figure 5. The structure of the embedded Module I (ERα-GATA3-XBP1-MYC).
The subplots illustrate gene expression patterns and corresponding SNR values for those module components. Module I contains only one self-inhibition loop (XBP1). And the corresponding time-course gene expression plots and inherent expression patterns are given in right panels, together with the up-/down-regulated information (+/−) for each gene on the rightmost column of the bottom plot. MYC and XBP1 are up-regulated in the module.

