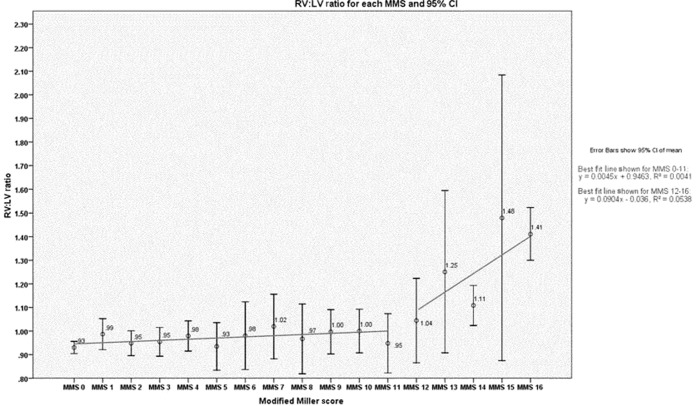
Figure 3.
Graph of data showing the relationship of mean RV:LV ratio with MMS—with the RV:LV ratio remaining stable until MMS ≥12 is reached—with a statistically significant higher mean ratio for patients with higher thrombus loads (MMS ≥12) than the non-PE cohort (p<0.0001). CI, confidence interval; LV, left ventricular; MMS, modified Miller score; RV, right ventricular.

