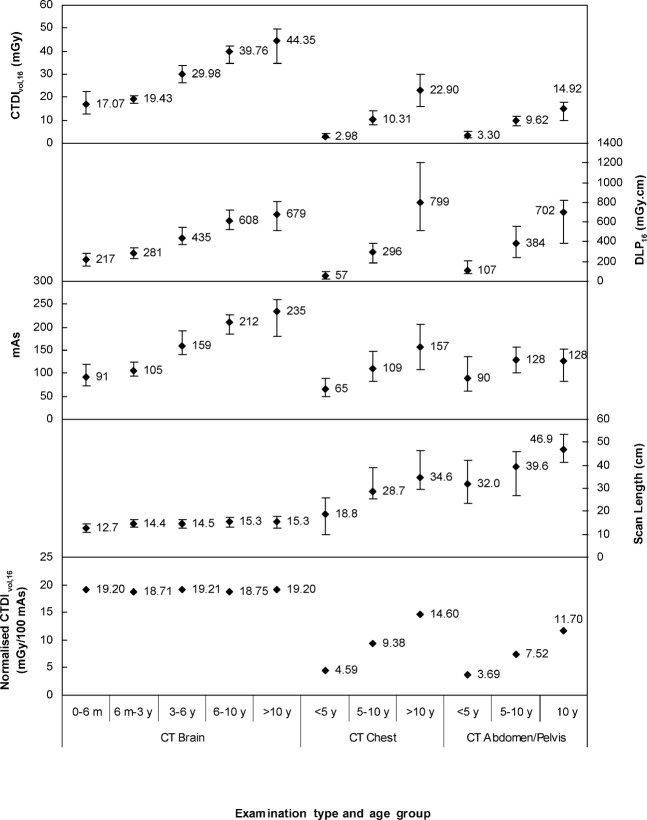
Figure 2.
Range and mean values of volumetric CT dose index relative to the 16-cm dosimetry phantom (CTDIvol,16), dose–length product relative to the 16-cm dosimetry phantom (DLP16), mAs (actual mAs, not effective mAs) and scan length for different age groups for CT brain, chest and abdomen/pelvis examinations from the paediatric dose survey. The bottom panel shows normalised median CTDIvol,16 values. Age groups are defined in terms of months (m) or years (y).

