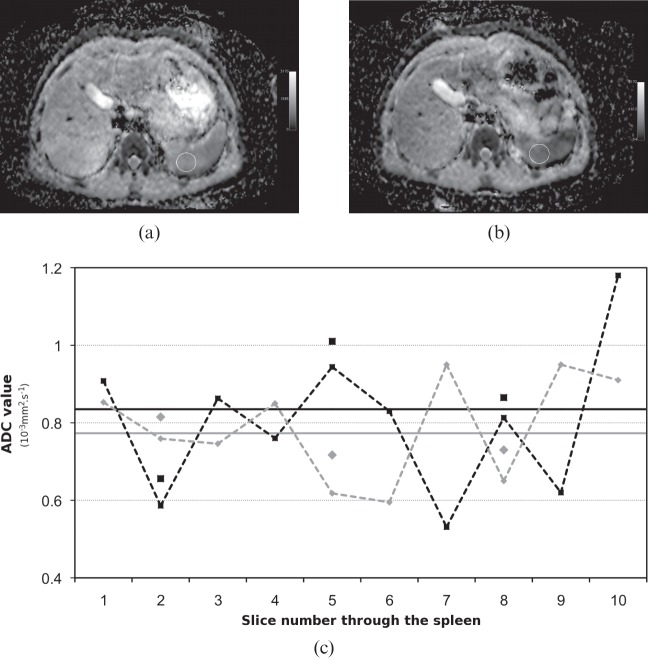
Figure 2.
Example of apparent diffusion coefficient (ADC) measurements through the spleen. (a) ADC map of slice 5 through the spleen, showing a region of interest (ROI) used for analysis. (b) Anatomically equivalent slice on the repeat visit. (c) ADC values through the spleen (black, visit 1; grey; visit 2). Solid line, mean of the entire organ (volume of interest analysis); dashed lines, mean ADC value for the spleen in this slice; individual points, mean ADC value for the ROI.

