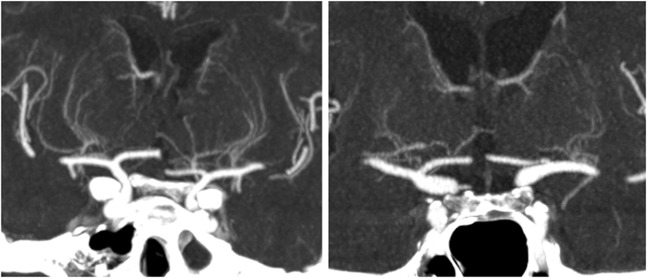
Figure 5.
Illustration of differences in visualised lenticulostriate artery branches between (left) a normotensive patient (60 years old) and (right) a hypertensive patient (61 years old). Large differences were observed in these cases. These images were reconstructed from 0.5-mm original data into a 10-mm coronal slab by using maximum intensity projection.

