
Figure 1.
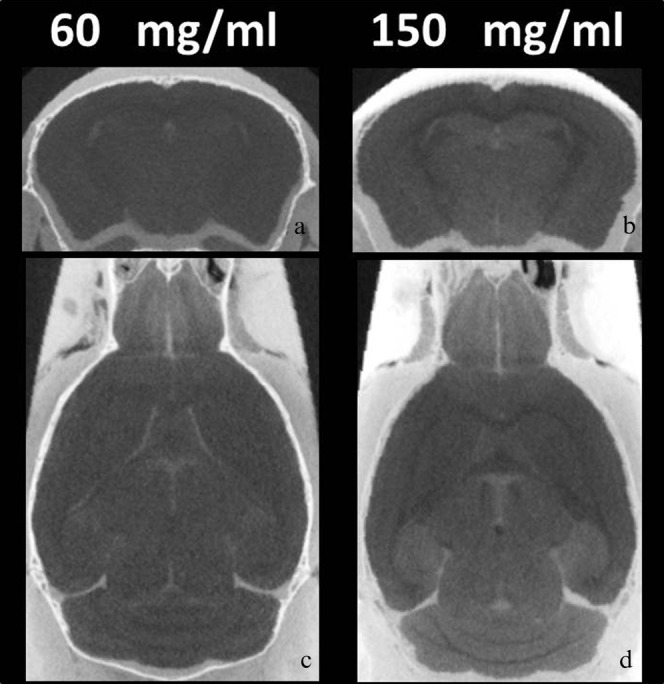
Micro-CT images with different non-ionic iodinated contrast agent concentrations. (a) Typical axial image of micro-CT with 60 mg ml−1 non-ionic iodinated contrast agent. (b) Typical axial image of micro-CT with 150 mg ml−1 contrast agent. (c) Typical horizontal image of micro-CT with 60 mg ml−1 contrast agent. (d) Typical horizontal image of micro-CT with 60 mg ml−1 contrast agent 150 mg ml−1. Soaking the brains in contrast agent resulted in clear differences in signal between the grey matter, the white matter and the ventricular spaces in the mouse brains. The CNR was significantly increased in 150 mg ml−1 as compared with 60 mg ml−1 (p<0.0001).