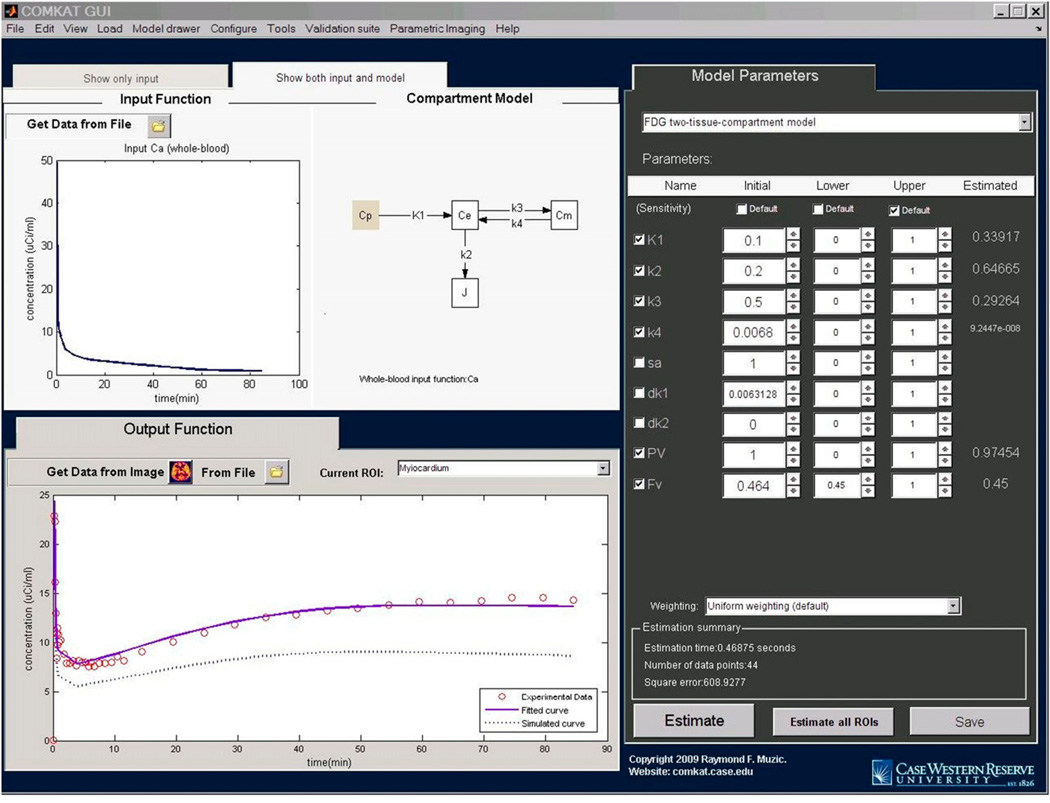
FIGURE 3.
COMKAT GUI with input function and experimental data specified. On screen, both model and data are loaded. Users may click buttons next to parameter values or enter their values, and model output curves are immediately updated. Once the user is satisfied with the initial guess, the computer will optimize values to fit data when the “Estimate” button is clicked. Parameter values will be estimated, and the fitted curve will be plotted on output function figure. Values for rate constants are specified in units of min−1.

