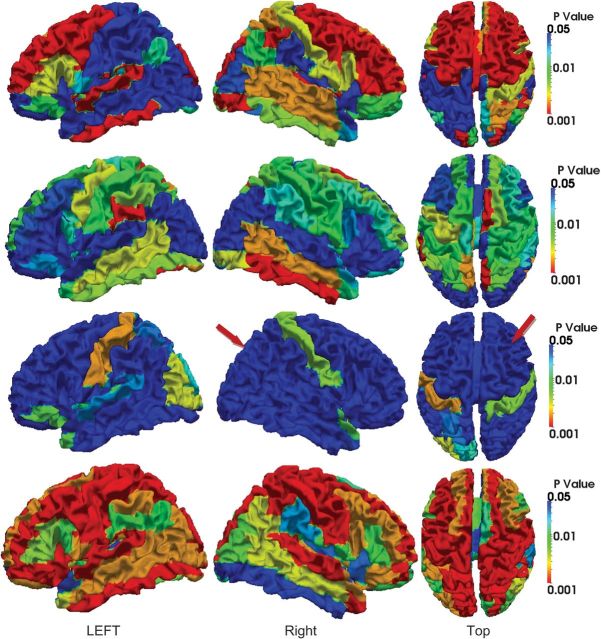
Figure 12.
P values of ROI-based curvedness changes on the 10 subjects, from 2 weeks to 12 months old. The results from 2 weeks to 3 months, 3–6 months, 6–9 months, and 9–12 months are shown from the first to the fourth row, respectively. The color bars are given on the right. In each row, both side views and top view are displayed.

