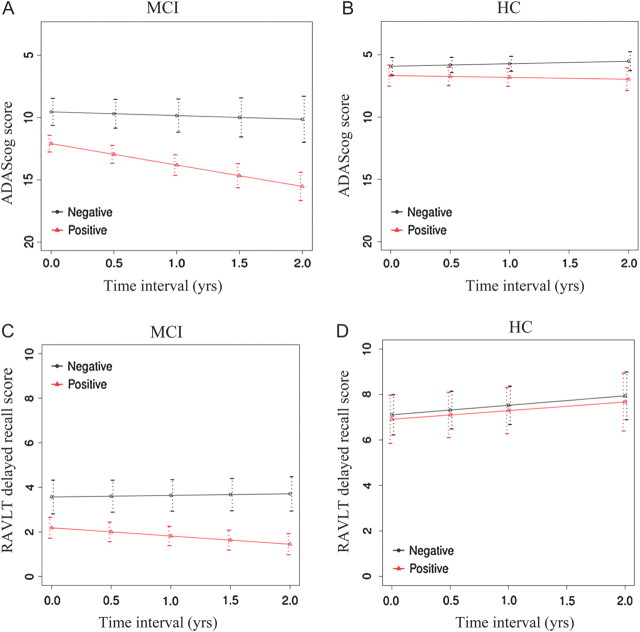
Figure 3.
Regression plot of estimated longitudinal decline in the ADAS-cog (A and B) and delayed RAVLT scores (C and D) over the follow-up period (years) for iPIB-PET(+) subjects (red line) versus iPIB-PET(−) subjects (black line) in MCI (A and C) and HC (B and D). The difference in the rate of decline between iPIB-PET groups was statistically significant for measures, except for ADAS-cog in the HC group (see Results).

