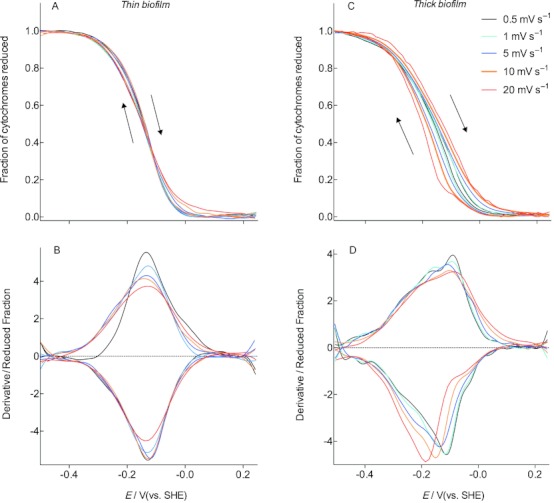
Figure 5.

Voltabsorptometry profiles for G. sulfurreducens biofilms less than 5 μm thick which were depleted of acetate. Data in (A) shows how cytochrome redox status remains similar as scan rate is increased, irrespective of direction, and the derivative in (B) reveals the slight broadening of the response without peak shifting. C, D) Voltabsorptometry profiles for G. sulfurreducens biofilms 20 μm thick, which were depleted of acetate. Beyond scan rates of 1 mV s−1, c-type cytochrome absorbance lagged behind changes in electrode potential, producing the hysteresis in the higher potential window in (C), and peak shifting of the derivative in (D).
