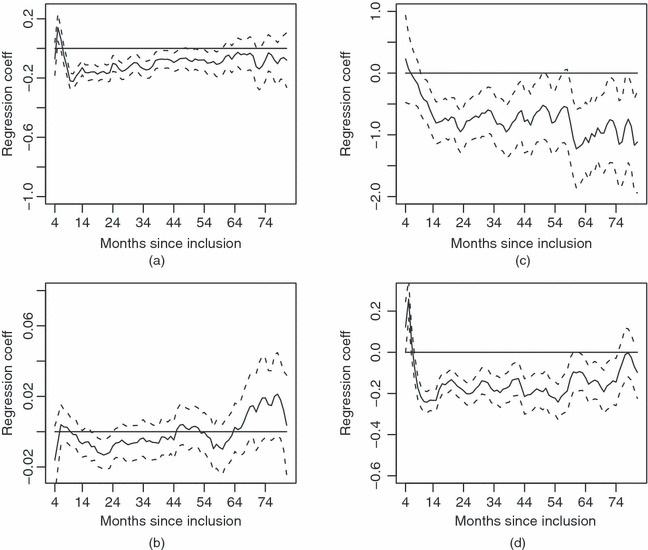
Figure 10.

Patients not on HAART: two regression analyses are presented, with (a), (b) increments of HIV-1 RNA and (c), (d) increments of CD4 cell values as dependent variables, and lagged values of HIV-1 RNA and CD4 cell values as independent values; the analysis is performed for each month
