Figure 6.

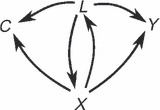
Local independence graph showing how the treatment process X influences the outcome process Y, the confounder process L and the censoring process C: the confounder process L influences X, Y and C

Local independence graph showing how the treatment process X influences the outcome process Y, the confounder process L and the censoring process C: the confounder process L influences X, Y and C