
Figure 2.
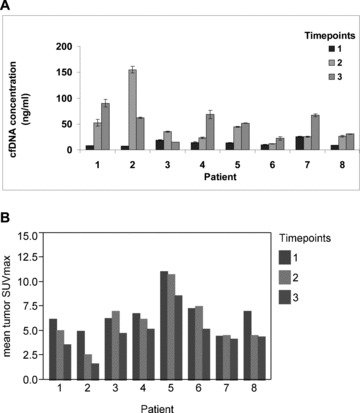
Chemotherapy‐associated changes in cfDNA content and global tumor metabolic activity on FCH PET/CT. A significant increase in cfDNA was observed over the course of chemotherapy ( A ). Error bars for triplicate qPCR measurements are shown for each quantity. A corresponding pattern of decreasing mean tumor activity (SUVmax) was observed with chemotherapy ( B ). Time points correspond to pretreatment (1), after one chemotherapy cycle (2), and after three chemotherapy cycles (3).