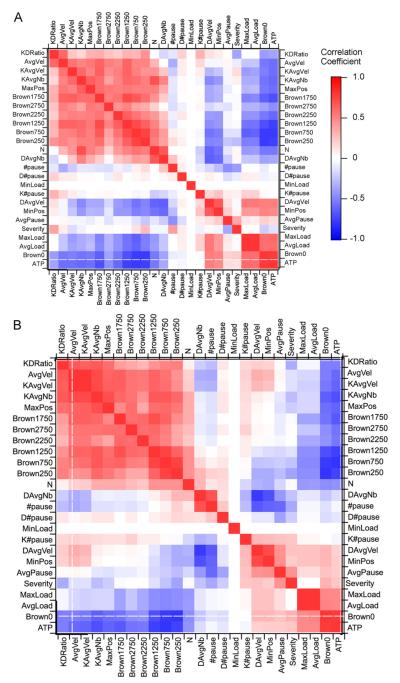
Fig. 10.
Landscape comparison of quantitative measures for depleted and diluted motor populations. The landscapes represent the cross-correlation values of a few key input parameters as well as quantified outcome measures for each simulation. Measures, which were derived from the experimental physiological axonal transport literature, are described in Table 1. (A) Depleted motor population landscape. (B) Diluted motor population landscape.

