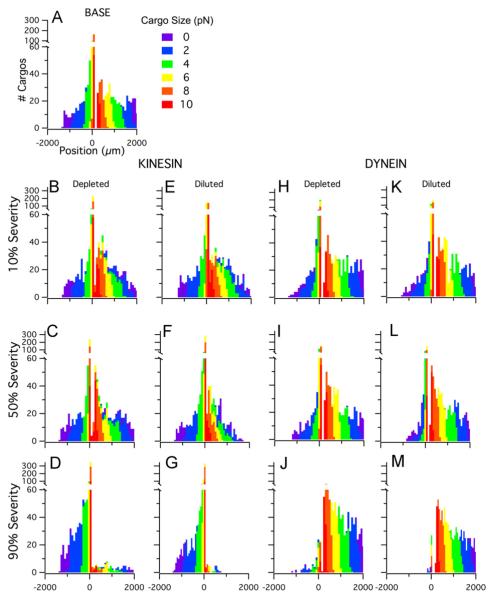
Fig. 7.
Cargo distributions for depletion and dilution impairments that affect either kinesin or dynein (with concomitant protein aggregation). All distributions contain 1000 cargos and show the final cargo positions (μm) after one hour. Colors indicate cargo sizes (0.1–10 pN). (A) No defects (e.g. 0% severity). Shown for comparison. (B–D) Depleted kinesin population at 10%, 50%, and 90% severity. (E–G) Diluted kinesin population at 10%, 50%, and 90% severity. (H–J) Depleted dynein at 10, 50, 90% severity. (K–M) Diluted dynein at 10%, 50%, and 90% severity. (For interpretation of the references to color in this figure legend, the reader is referred to the web version of this article.)

