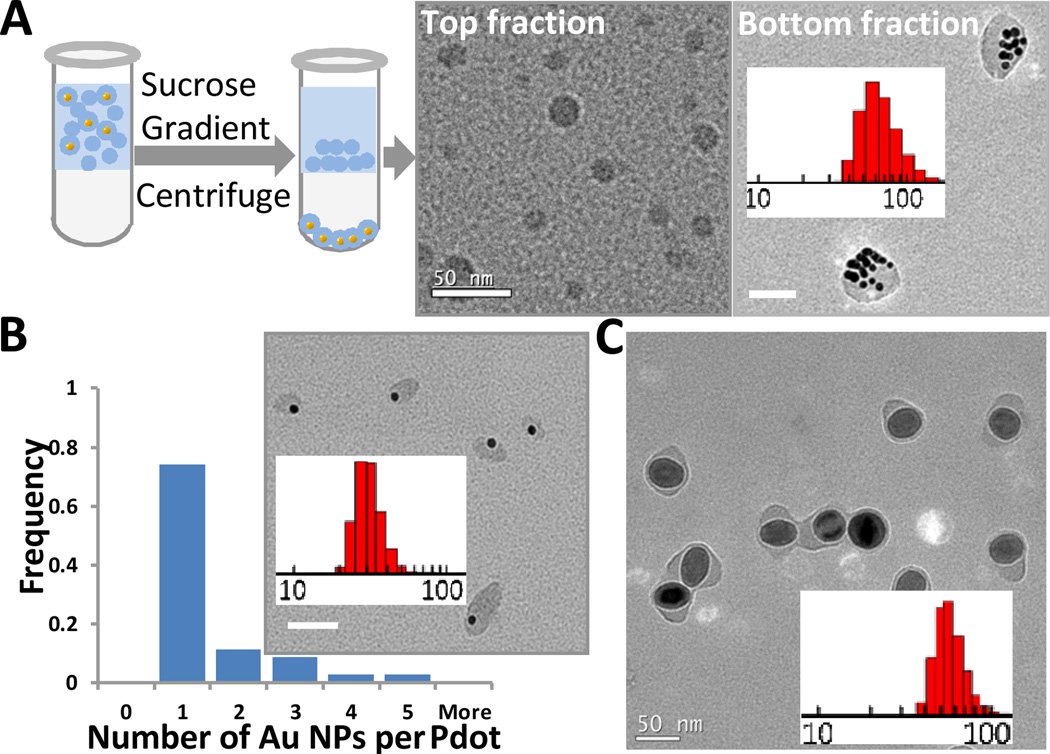
Fig. 1.
Separation of Pdots with gold or iron oxide nanoparticles from empty ones. (A) Schematic depicting the purification procedure using centrifugation with a step sucrose gradient. TEM images of empty Pdots retrieved from the fraction above the sucrose solution (left) and Au-NP-Pdots from the bottom fraction of the tube (right). The inset histogram shows the size distribution of Au-NP-Pdots. The average size was 65 nm. (B) TEM image of Pdots containing a single Au nanoparticle and a histogram showing the number of Au NPs in each Pdot. The average size was 28 nm. The inset histogram is the size distribution of Au-NP-Pdots. (C) TEM image of FeOx-NP-Pdots. The average size was 52 nm. The FeOx nanoparticles were 40 nm in diameter. The inset histogram is the size distribution of FeOx-NP-Pdots. Scale bar represents 50 nm.

