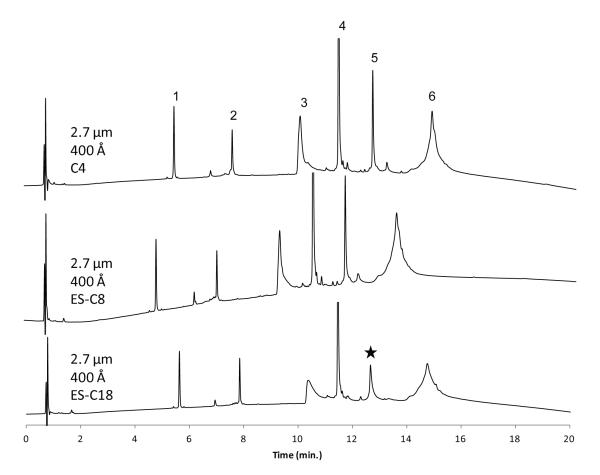
Figure 4.
Effect of bonded phase on protein separation
Columns: 2.1 × 100 mm; Mobile phase gradient: 20-70% acetonitrile/aqueous 0.1% trifluoroacetic acid in 20 min; Flow rate: 0.3 mL/min; Temperature: 60 °C; Injection: 1 μL; Detection: 215 nm; Peak identities: (1) ribonuclease A – 13.7 kDa (2) cytochrome c – 12.4 kDa (3) bovine serum albumin – 66.4 kDa (4) apomyoglobin – 17 kDa (5) enolase – 46.7 kDa (6) phosphorylase b – 97.2 kDa; Instrument: Agilent 1200 SL with autosampler; Star shows an apparent loss of enolase protein on the ES-C18 column

