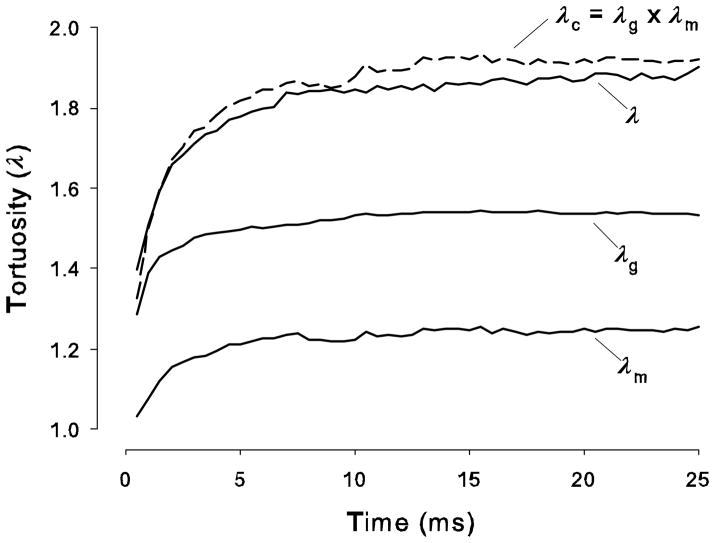
Figure 8.
Multiplicative properties of tortuosities. Curve labeled ‘λg’ represents tortuosity computed, using Eq (11), from an MCell simulation in a medium with cubes and voids (i.e. one cube in eight removed) as a function of time after release of 5000 Ca2+ molecules from origin. Curve labeled ‘λm’ represent a similar tortuosity calculation in a medium containing only matrix at a concentration of 2.34 μM (i.e. no geometry present). Curve labeled ‘λ’ represents tortuosity calculated in a medium with cubes and voids but with a quantity of matrix in the voids such that the matrix concentration averaged over the whole ECS is also 2.34 μM. Finally, ‘λc’ represents the product of the λg and λm curves. It is seen that λ and λc are close in value. Parameters: kf, kb and D as for Fig. 7; α = 0.2.

