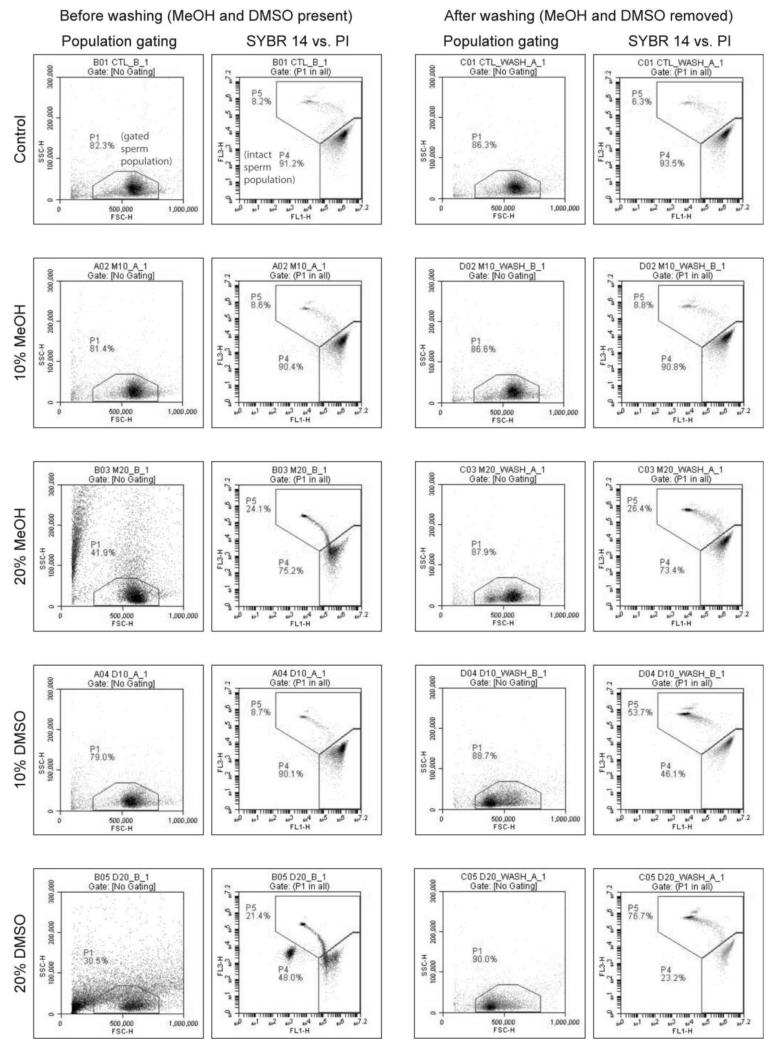
Figure 1.
Forward scatter vs. side scatter (FSC vs. SSC) and FL1 vs. FL3 (SYBR 14 vs. PI) scatter plots of zebrafish sperm exposed to treatments containing HBSS alone, and HBSS containing10% and 20% methanol (MeOH) ordimethyl sulfoxide (DMSO). The region designated as“P1” in the FSC vs. SSC plot is the gated sperm population, and the region designated as “P4” in the SYBR 14 vs. PI plot is the intact sperm population.

