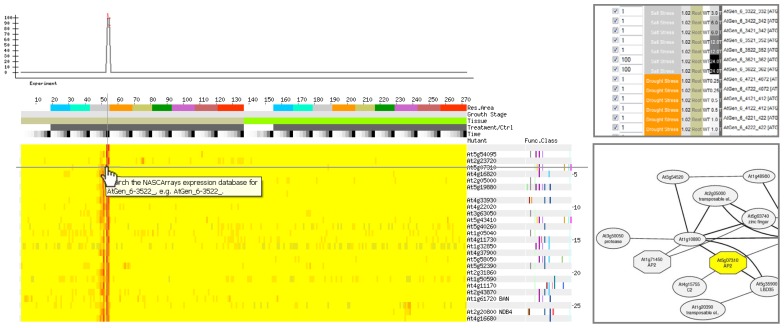
FIGURE 1.
A gene may be identified having an expression pattern as shown in the top left. Alternately, a vector can be designed that exhibits a desired behavior. Coexpression analysis on an abiotic stress compendium produced by Kilian et al. (2007) returns genes exhibiting similar patterns of expression. In this example, only genes exhibiting strong expression in roots after 24 h of exposure to salt as specified using the AtGenExpress Stress Set and Expression Angler (Toufighi et al., 2005) running in the Subselect and Custom Bait mode (top right), are returned by the analysis, as shown in the heatmap on the bottom left. The partial network on the bottom right is an alternate depiction of the relationship between one of the output genes from this example, At5g07310 – whose gene product possesses an AP2 domain, and other genes in a condition-independent coexpression analysis provided by ATTEDII (Obayashi et al., 2009). In this network representation, nodes represent genes, and the edges represent a significant interaction as defined by coexpression scores: the thicker the edges the better the coexpression score.

