FIGURE 1.

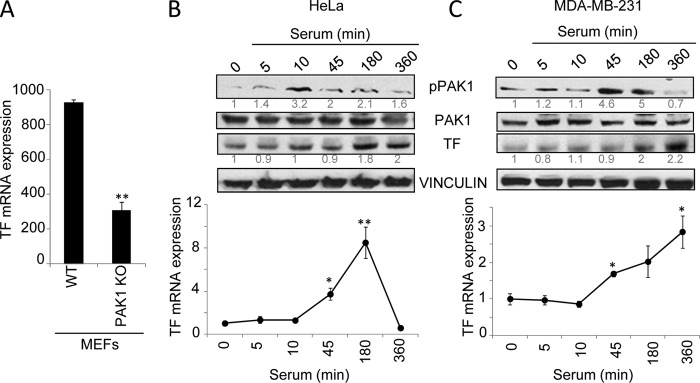
PAK1 up-regulates tissue factor expression. A, microarray RT-qPCR validation of TF mRNA expression in the WT and PAK1-KO MEFs. The relative mRNA expression levels are represented; mouse 18 S was used to normalize the values. **, p < 0.001 versus WT MEFs. B and C, expression of tissue factor protein (upper panel) and mRNA (lower panel) levels was analyzed after serum induction for the indicated times (minutes) in HeLa (B) and MDA-MB-231 cells (C). B and C, upper panel, Western blot using phospho-PAK1 (pPAK1), PAK1, and TF antibodies. The expression of vinculin was used as a loading control. The numbers below the panels (in gray) indicate the densitometric values corresponding to the quantification of the bands detected by autoradiography. A representative Western blot, from a total of three independent experiments, is shown. B and C, lower panel, total mRNA from HeLa (B) or MDA-MB-231 (C) cells induced with serum for the indicated times was analyzed for the expression of TF mRNA by RT-qPCR. The relative mRNA expression levels are represented; actin expression was used to normalize the values. Each value represents the mean ± S.E. of three independent experiments. *, p < 0.005; **, p < 0.001 in serum-stimulated cells compared with nonstimulated cells. min, minutes.
