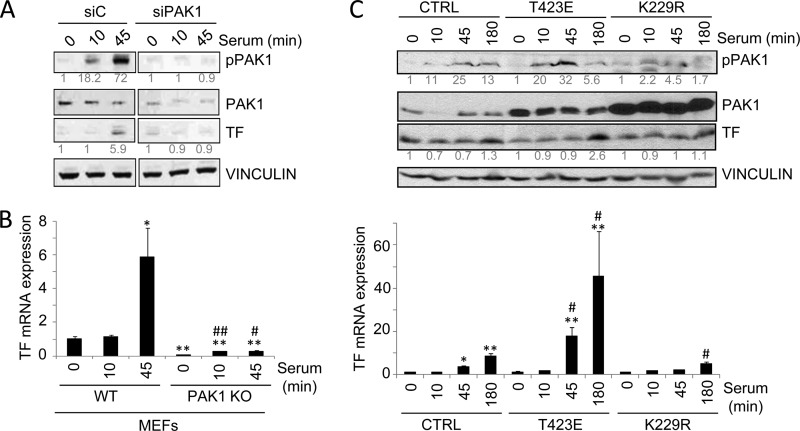
FIGURE 2.
PAK1 is required for the up-regulation of tissue factor by serum. A, Western blot analysis of phospho-PAK1, PAK1 and TF in HeLa cells transiently transfected with an siRNA against PAK1 (siPAK1) or an siRNA control (siC) induced with serum for the indicated times (in minutes). The expression of vinculin was used as a loading control. The numbers below the panels (in gray) indicate the densitometric values corresponding to the quantification of the bands detected by autoradiography. A representative Western blot, from a total of three independent experiments, is shown. B, RT-qPCR analysis of TF mRNA in WT and PAK1-KO MEFs cells induced with serum for the indicated times (in minutes). The relative mRNA expression levels are represented; mouse 18 S expression was used to normalize the values. Each value represents the mean ± S.E. of three independent experiments.*, p < 0.005; **, p < 0.001 versus nonstimulated WT MEFs. #, p < 0.005; ##, p < 0.001 versus serum-stimulated WT MEFs. C, Western blot (upper panel) and RT-qPCR analysis (lower panel) in HeLa cells transiently transfected with the catalytically active (T423E), kinase-dead (K229R) PAK1 mutants, or with the empty vector (CTRL) induced with serum for the indicated times. C, upper panel, cell lysates were blotted with p-PAK1, PAK1, and TF antibodies. The expression of vinculin was used as a loading control. The numbers below the panels (in gray) indicate the densitometric values corresponding to the quantification of the bands detected by autoradiography. A representative Western blot, from a total of three independent experiments, is shown. C, lower panel, total mRNA was analyzed for the expression of TF mRNA by RT-qPCR. The relative mRNA expression levels are represented; actin expression was used to normalize the values. Each value represents the mean ± S.E. of three independent experiments. *, p < 0.005; **, p < 0.001 versus nonstimulated control (CTRL) cells. #, p < 0.005 versus serum-stimulated control (CTRL) cells. min, minutes.

