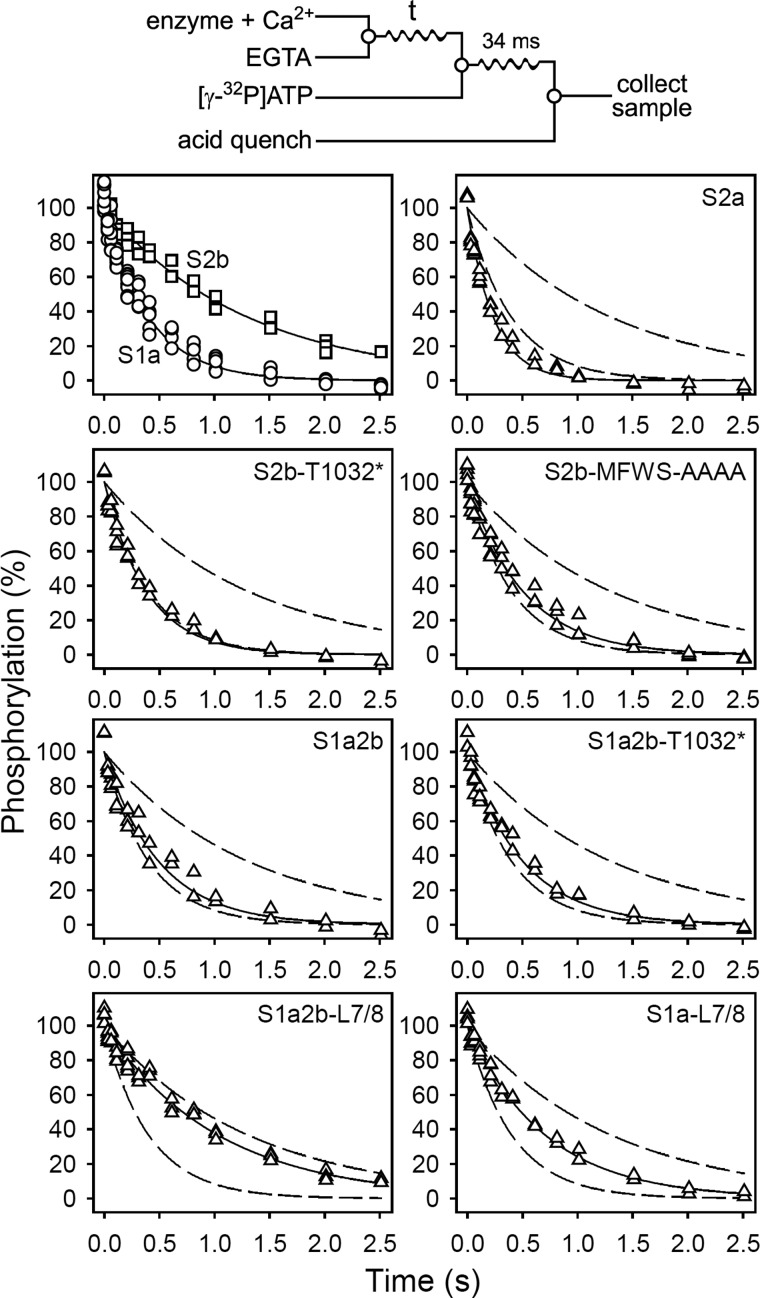
FIGURE 2.
Kinetics of the dissociation of Ca2+ at the cytoplasmically facing sites. Quench-flow experiments were carried out by the mixing protocol illustrated by the diagram above the panels using a QFM-5 module at 25 °C. The microsomal enzyme, preincubated in 40 mm MES/Tris (pH 6.0), 80 mm KCl, 5 mm MgCl2, and 100 μm CaCl2 (to accumulate Ca2E1), was mixed with an equal volume of 40 mm MES/Tris (pH 6.0), 80 mm KCl, 5 mm MgCl2, and 4 mm EGTA, to initiate Ca2+ dissociation. At the indicated time intervals the amount of phosphorylatable Ca2E1 remaining was determined by adding the double volume of 40 mm MES/Tris (pH 6.0), 80 mm KCl, 5 mm MgCl2, 2 mm EGTA, and 10 μm [γ-32P]ATP, followed by acid quenching 34 ms later. To obtain the point corresponding to zero time (in each case taken as 100%), 4 mm EGTA was replaced by 100 μm CaCl2. All data points are shown. The lines show the best nonlinear regression fits of a monoexponential decay function, giving the rate constants listed in Table 2. The broken lines represent the curves corresponding to wild type SERCA1a and SERCA2b from the upper left panel.

