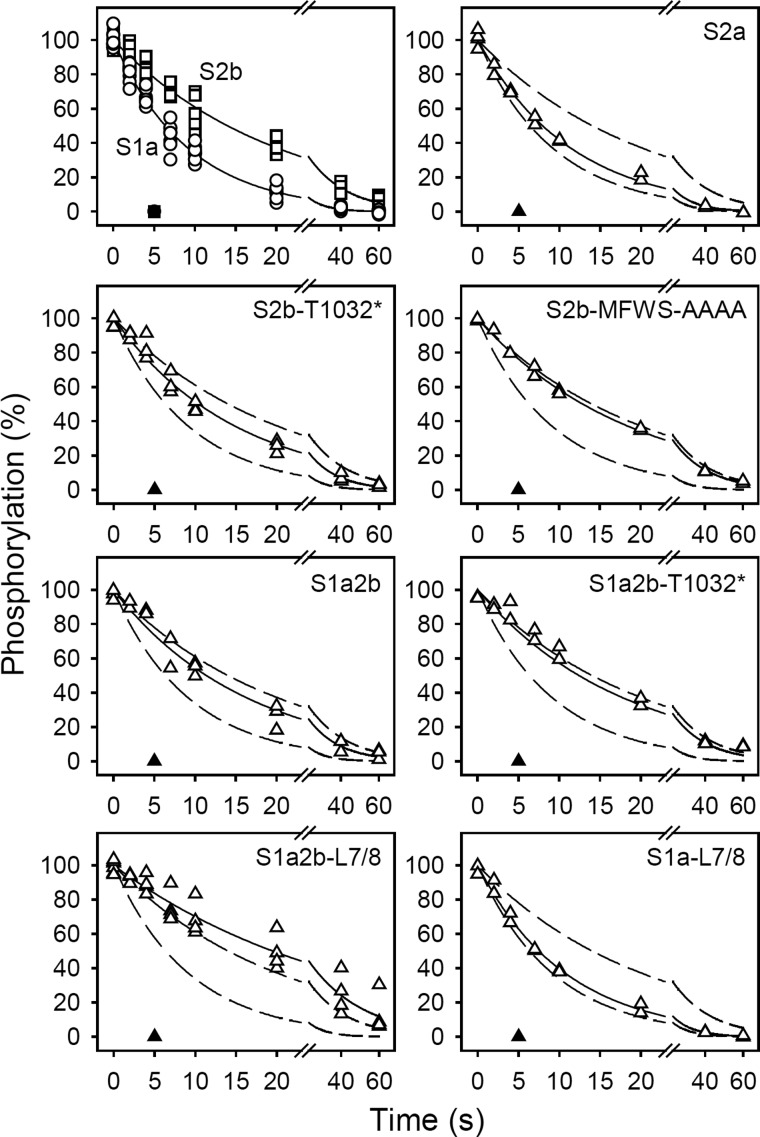
FIGURE 3.
Kinetics of the Ca2E1P → E2P transition. The microsomal enzyme was phosphorylated by incubation for 15 s at 0 °C in 40 mm MOPS/Tris (pH 7.0), 80 mm KCl, 5 mm MgCl2, 1 mm EGTA, 0.955 mm CaCl2 (giving a free Ca2+ concentration of 10 μm during phosphorylation), 2 μm calcium ionophore A23187, and 5 μm [γ-32P]ATP. Dephosphorylation was then studied at 0 °C by addition of excess EGTA (to remove Ca2+ and, thus, terminate phosphorylation) followed by acid quenching at the indicated time intervals (open symbols). All data points are shown. The lines show the best nonlinear regression fits of a monoexponential decay function, giving the rate constants listed in Table 2. The closed symbols represent similar experiments in which 1 mm ADP was added together with the EGTA chase medium. In each case, the 100% value corresponds to the steady-state level of phosphoenzyme present just prior to the initiation of dephosphorylation. The broken lines represent the curves corresponding to wild type SERCA1a and SERCA2b from the upper left panel.

