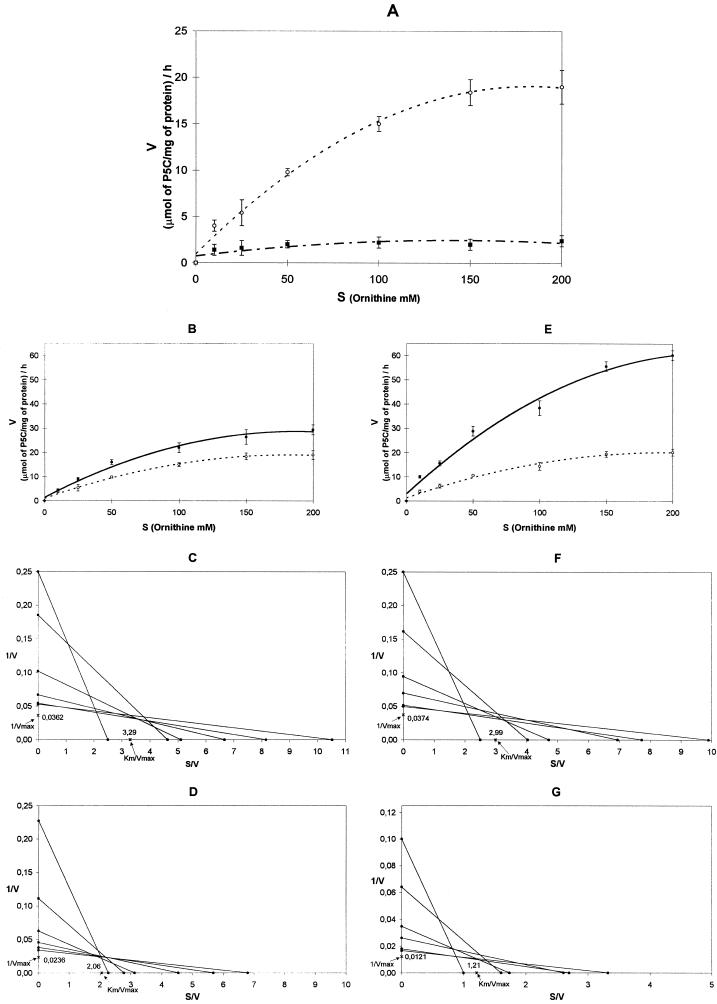
Figure 5.
A, δ-OAT Orn saturation patterns of 12-d-old plantlets (▪) and 4-week-old plants (○). B and E, Orn saturation patterns of 12-d-old plantlets in normal conditions (○; control) and salt-stress conditions (200 mm NaCl; •) after incubation for 24 h (B) and 72 h (E). The direct linear plot of 1/V against S/V (see text for explanation) was used to estimate the parameters of Km and Vmax. Km and Vmax were calculated for 12-d-old plantlets after incubation for 24 and 72 h under normal conditions (C and F, respectively) and under salt-stress conditions (D and G, respectively).

