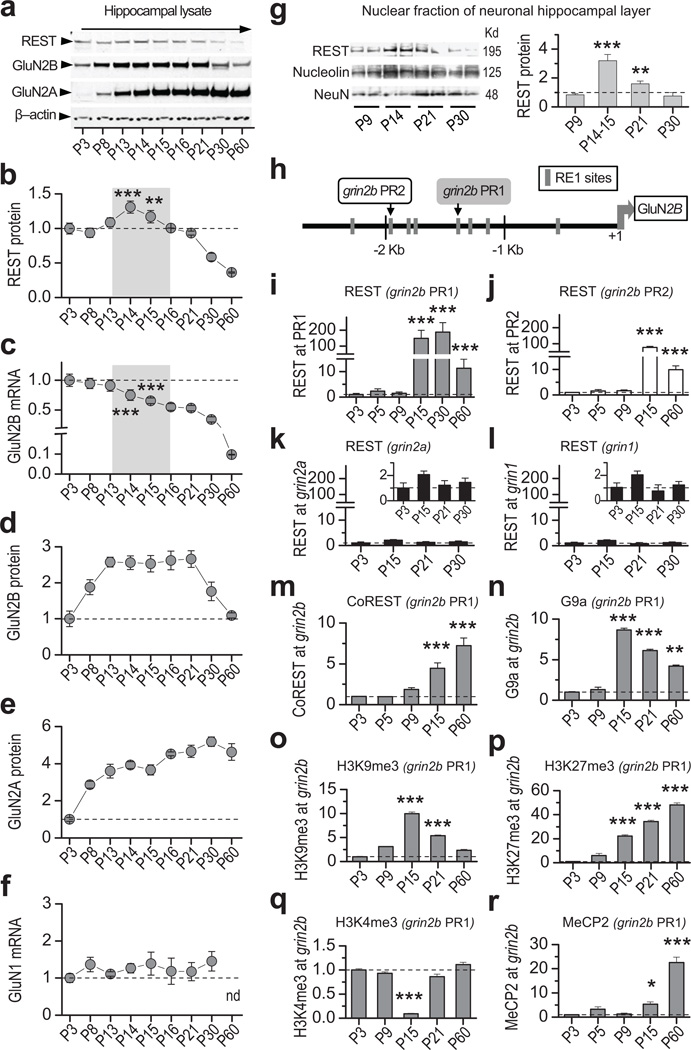
Figure 1. REST increases transiently, is recruited to and coincides with epigenetic marks of repression at the grin2b promoter during rat hippocampal postnatal development.
a, Representative Western blots of whole hippocampal lysates showing that REST increases, GluN2B declines, and GluN2A increases during postnatal development (see full-length blot in Supplementary Fig. 1a). b, Time course showing that REST protein increases transiently at P14–15 (n = 5). c, GluN2B mRNA exhibits a long-term decline during postnatal development, assessed by RT-qPCR. The decline was highly significant from P15 through P60 (vs. P3; n = 5). d,e, Time course showing that whereas GluN2B protein declines after P21 (n = 6), GluN2A protein increases markedly from P8 to P16 and remains high up to P60 (n = 3). Data were normalized to corresponding values at P3. f, GluN1 mRNA is not altered during postnatal development (n = 6). g, Representative Western blot (left panel) and summary data (right panel) show REST protein expression in the nuclear fraction of the hippocampal cell body layer, which is enriched for neurons. Note that REST abundance in the neuronal nuclear fraction increases strikingly by P14–15 (n = 4). Data were normalized to corresponding data at P9. See full-length blot in Supplementary Fig. 12). h, Map of the rat grin2b gene indicating location of RE1 motifs contained within the proximal (PR1; gray box) and distal (PR2; white box) regions of the grin2b promoter probed by chromatin immunoprecipitation (ChIP). i,j, REST occupancy is markedly enriched at the grin2b proximal (PR1, grey bars) (n = 6) and distal PR2 (white bars) (n = 3) promoters at P15 but declines by P60. k,l, REST is not enriched at RE1 sites within the grin2a (n = 9), nor grin1 (n = 6) promoters. Inset, same data depicted with expanded y-axis. m,n, CoREST (n = 3) and G9a (n = 3) are enriched at PR1 by P15. o,p, Increase in H3K9me3 (n = 3) and H3K27me3 (n = 6) (marks of repression) at P15. q, Decrease in trimethylation of H3K4 (n = 3) (mark of active transcription), at PR1. r, MeCP2 occupancy is enriched at grin2b PR1 by P15 with a sharp increase by P60 (n = 3). All samples were normalized to input and to corresponding values at P3. Summary data represent the mean ± s.e.m. *p < 0.05; **p < 0.01; ***p < 0.001.

