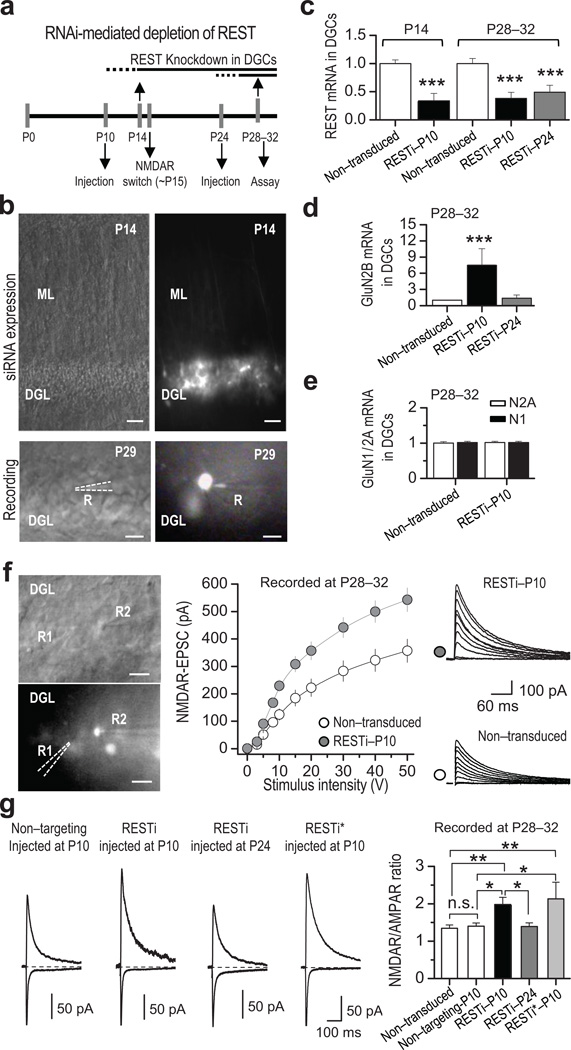
Figure 3. RNAi-mediated depletion of REST increases GluN2B mRNA and alters NMDAR properties.
a, Diagram illustrating RNAi injection and time course of assays (qRT-PCR or patch recording). Lentiviral mediated RNAi directed against REST (RESTi) and nontargeting RNAi were delivered by means of sterotaxic injection into the hippocampus of rats at P10 or P24, and evaluated at indicated time points. b, Differential interference contrast (DIC) and GFP fluorescence images showing viral-mediated transduction of DGCs at P14 (top), and a patched DGC at P29 (bottom). Scale bars = 50 µm (top panel) and 20 µm (bottom panel). DGL, dentate granule cell layer; ML, molecular layer; R, recording pipette. c, RESTi delivered at P10 (RESTi-P10) effectively knocks down REST by P14 (n = 3), as assessed by qPCR. Delivery of RESTi at P10 and P24 (RESTi-P24) knocked-down REST measured at P28–32 (n = 3) in dentate granule cells (DGCs). d, RESTi injected at P10, but not P24, significantly increased GluN2B mRNA(n = 3) measured at P28–32. e, RESTi delivered at P10 does not exert any effect on GluN2A (n = 3) or GluN1 (n = 3) mRNA expression measured at P28–32. f, Representative DIC (top left panel) and fluorescence (bottom left panel) images showing simultaneous whole-cell recordings from RESTi-P10 expressing (GFP+) and non-transduced control (GFP−) DGCs. R1 and R2 indicate the recording pipettes from GFP− and GFP+ neurons, respectively. Scale bars = 20 µm. Summary data (middle panel) and representative traces (right panels), showing that delivery of RESTi at P10 (gray circles; 6 animals/13 cells) increases NMDAR-mediated transmission relative to that of neighboring non-transduced (control) neurons (white circles; 6 animals/13 cells). g, Representative traces (left) and summary data (right) showing that the NMDAR/AMPAR ratio is higher in DGCs expressing REST RNAi delivered at P10 (6 animals/23 cells) but not at P24 (6 animals/18 cells) relative to non-transduced controls (6 animals/29 cells) or controls expressing nontargeting RNAi neurons (6 animals/18 cells). A second lentiviral mediated RNAi targeted to a different sequence in REST (RESTi*) also increased the NMDAR/AMPAR ratio (2 animals/7 cells). Summary data represent the mean ± s.e.m. *p < 0.05; **p < 0.01; ***p < 0.001; n.s., not significant.

