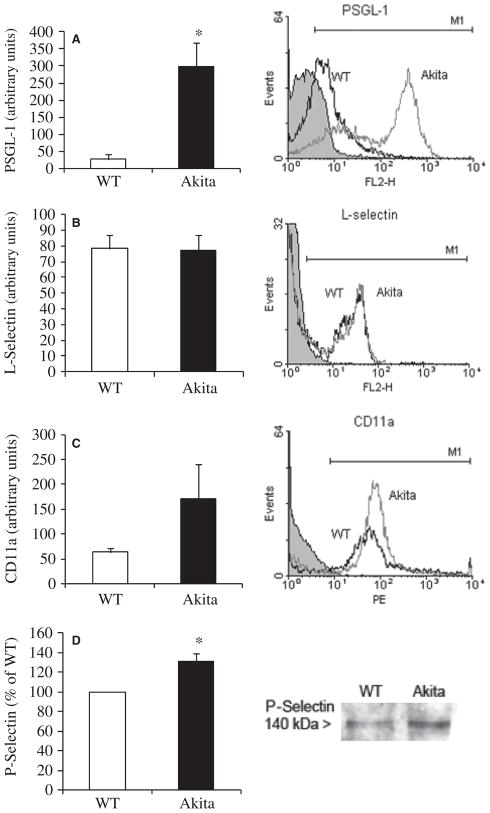
Fig. 4.
Leukocyte adhesion molecule expression in chronic hyperglycemia. (A) Flow cytometric analysis of peritoneal leukocytes showed increased surface expression of PSGL-1 (n = 6). (B,C) L-Selectin (n = 7) and CD11a (n = 4) expression ws not significantly different between WT and Akita leukocytes. Black line, WT; gray line, Akita: and black line with gray shaded area, IgG control. Representative histograms are shown on the left. (D) Densitometric analysis of P-selectin gingival expression assessed by western blot in Akita mice relative to WT. Data for P-selectin were normalized to total protein and expressed as a percentage of WT values (n = 5; *p < 0.05). FL2, orange fluorescence signal channel.

