Figure 2.
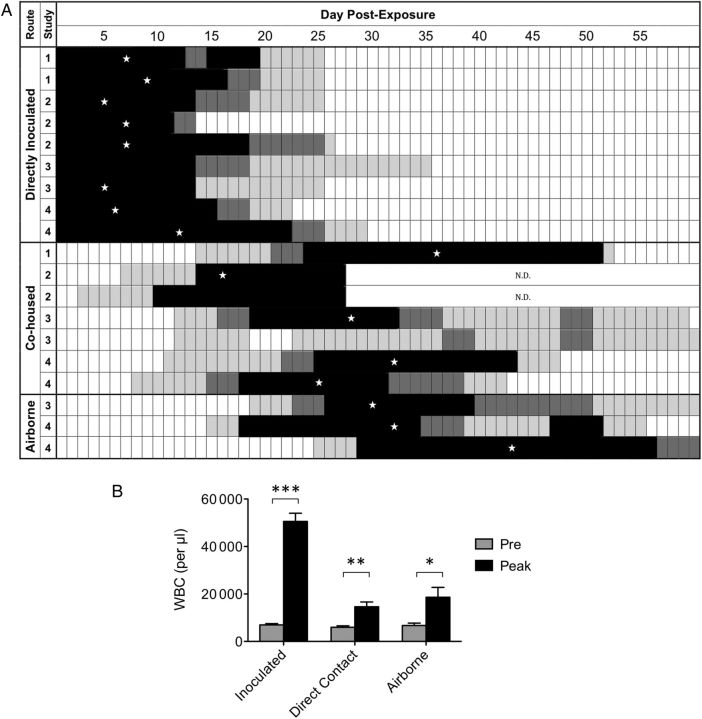
Colonization and leukocytosis in directly inoculated and exposed baboons. Weanling baboons were either inoculated directly with B. pertussis, as described in “Materials and Methods,” or cohoused with inoculated baboons in the same caging unit, or housed in a caging unit 7 feet away from the caging unit housing the inoculated baboons. Nasopharyngeal washes were performed as described in “Materials and Methods” and the recovered wash was plated on 2 Regan-Lowe plates (50 μL per plate). A, The number of colony-forming units per plate is indicated for each day by the shading of the boxes in the row corresponding to each individual animal: white = 0, light gray = 1–200 colonies, dark gray = 201–2000 colonies, and black = >2000 colonies. A star indicates the day of peak leukocytosis for each animal except for 2 animals that did not achieve a peak at least 2-fold higher than baseline. B, Once prior to challenge and on the indicated days post challenge, blood was drawn from each baboon and the number of circulating WBCs per µl of peripheral blood was determined as described in “Materials and Methods.” The average preinoculation WBC count and the average peak WBC count following inoculation is shown for the inoculated group (n = 9). The average preexposure WBC count and the average peak WBC count following exposure is shown for the cohoused group (n = 7) and for the airborne transmission group (n = 3). Within each group, significance was determined for pre- vs peak values: *P < .05, **P < .005, ***P < .0005. Abbreviations: N.D., not determined; WBC, white blood cell.

