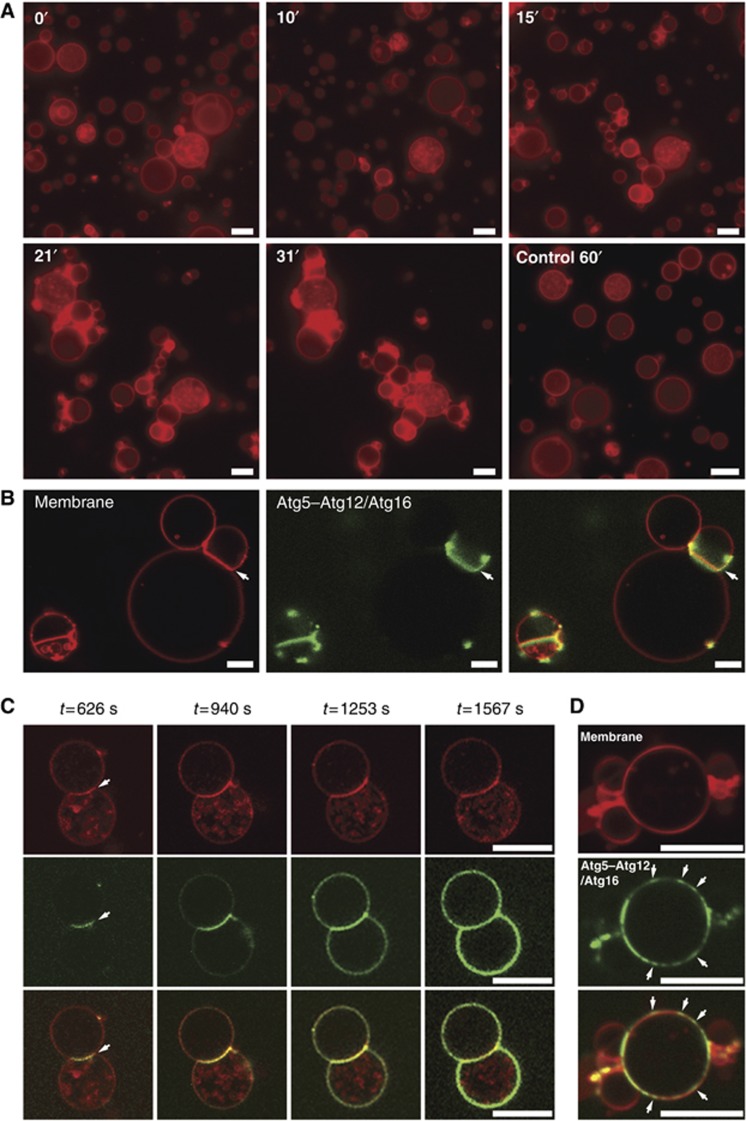
Figure 5.
Membrane tethering by the Atg5–Atg12/Atg16 complex. (A) Frames of widefield images taken from a time series of rhodamine-PE labelled GUVs in the presence of the Atg5–Atg12/Atg16 complex. For the control condition buffer but no protein was added. Note the increase in clustered GUVs over time. The numbers indicate the time in minutes. (B) Confocal images of rhodamine-PE labelled GUVs incubated with Atg5–Atg12/Atg16–eGFP complex. Note the accumulation of the complex at the interface between GUVs (arrows). (C) Individual confocal frames of a time series of rhodamine-PE labelled GUVs incubated with Atg5–Atg12/Atg16–eGFP. The arrows point to the GUV–GUV interface where the protein initially accumulated. (D) Confocal images of rhodamine-PE labelled GUVs incubated with Atg5–Atg12/Atg16–eGFP. The arrows point to the concentrations of Atg5–Atg12/Atg16 on the GUV membrane. Scale bars: 10 μm (A–C) and 3 μm (D).

