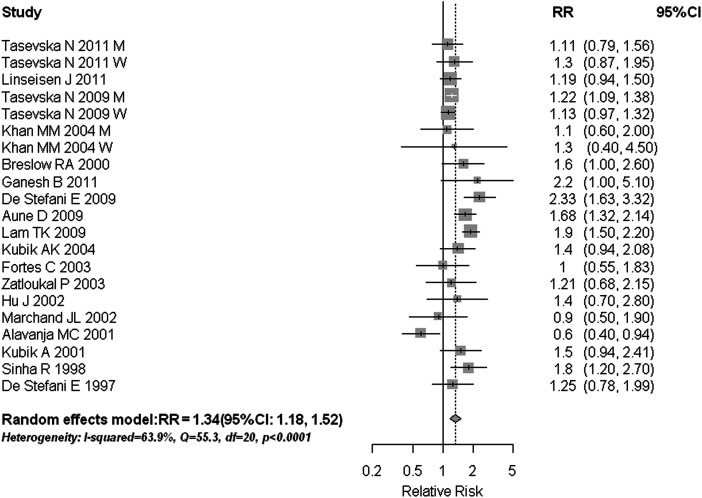
Figure 3.
Estimates (95% CIs) of red meat consumption and lung cancer risk. Squares represent study-specific estimates [size of the square reflects the study-specific statistical weight (i.e. inverse of the variance)]; horizontal lines represent 95% CIs; and diamonds represent summary estimates with corresponding 95% CIs. M, men; W, women.

