
Figure 2.
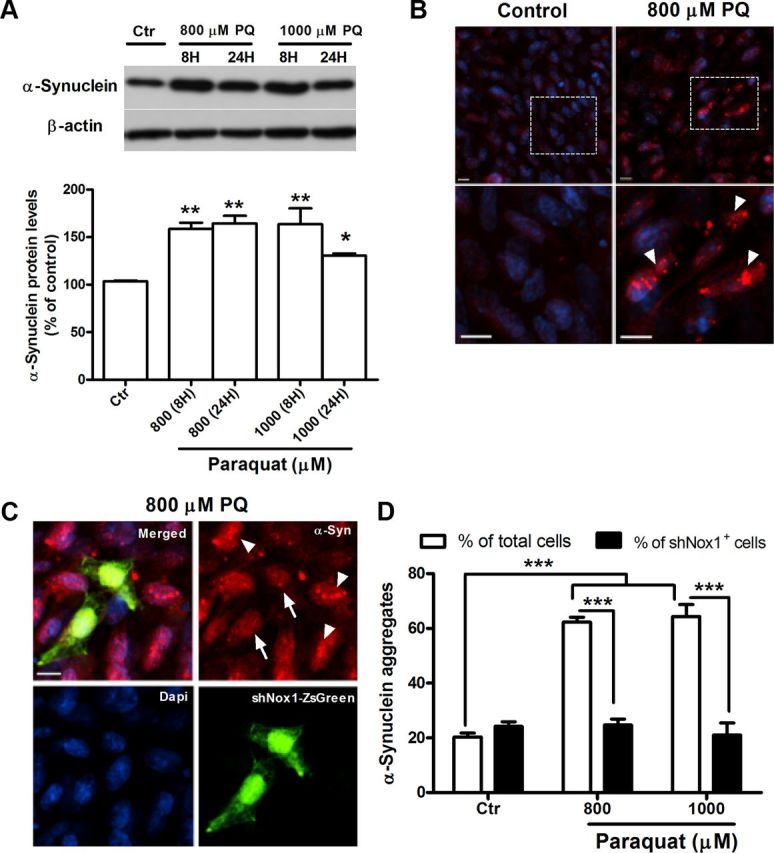
PQ induces increases of α-synuclein expression and aggregation in N27 cells, an event prevented by Nox1 knockdown. A, Representative immunoblot and quantitative analysis of α-synuclein protein levels. α-Synuclein protein was determined in total lysates of N27 cells exposed to PQ or control. β-Actin was used as an internal control. PQ significantly increased α-synuclein protein levels, which were quantified using Quantity One software and normalized against β-actin. B, Photomicrographs of aggregated α-synuclein immunoreactivity (red) in control and PQ-treated cells. The bottom shows higher magnification of respective boxed areas in the top. C, α-Synuclein fluorescence immunostaining of N27 cells incubated with Nox1 shRNA/LVX (shNox1-ZsGreen) viral particles for 36 h and then exposed to 800 μm PQ. shNox1-ZsGreen-infected cells were identified by green fluorescence (ZsGreen) in cells. D, Quantification of the cells depicting the bright, punctuated fluorescence, like the ones indicated with arrowheads in B and C. More than 30 assigned fields were analyzed in each independent experiment and in average the minimum number of total cells counted per condition was 700 cells. Data are shown as the mean ± SEM. Statistical analysis was performed using one-way ANOVA or two-way ANOVA, followed by Bonferroni's multiple-comparison test; *p < 0.05, **p < 0.01, and ***p < 0.001. Arrowheads specify cells with aggregated α-synuclein pattern, and the arrow indicates N27 cells showing double-staining for shNox1-ZsGreen and α-synuclein. Ctr, control; PQ, paraquat. Scale bars: 10 μm.